The following video covers some of several recent technical developments on the 60-minute chart of QQQ, the Nasdaq 100 tracking ETF, as well as couple of longer-term developments towards the end of the video. The three current charts covered in the video are posted below with the previous two charts on the $SPXA200R & the $NAA200R from this post from July 21, 2015. (click the first chart to expand, then click anywhere on the right of each chart to advance to the next expanded image. Expanded charts can be panned & zoomed for further detail).
-

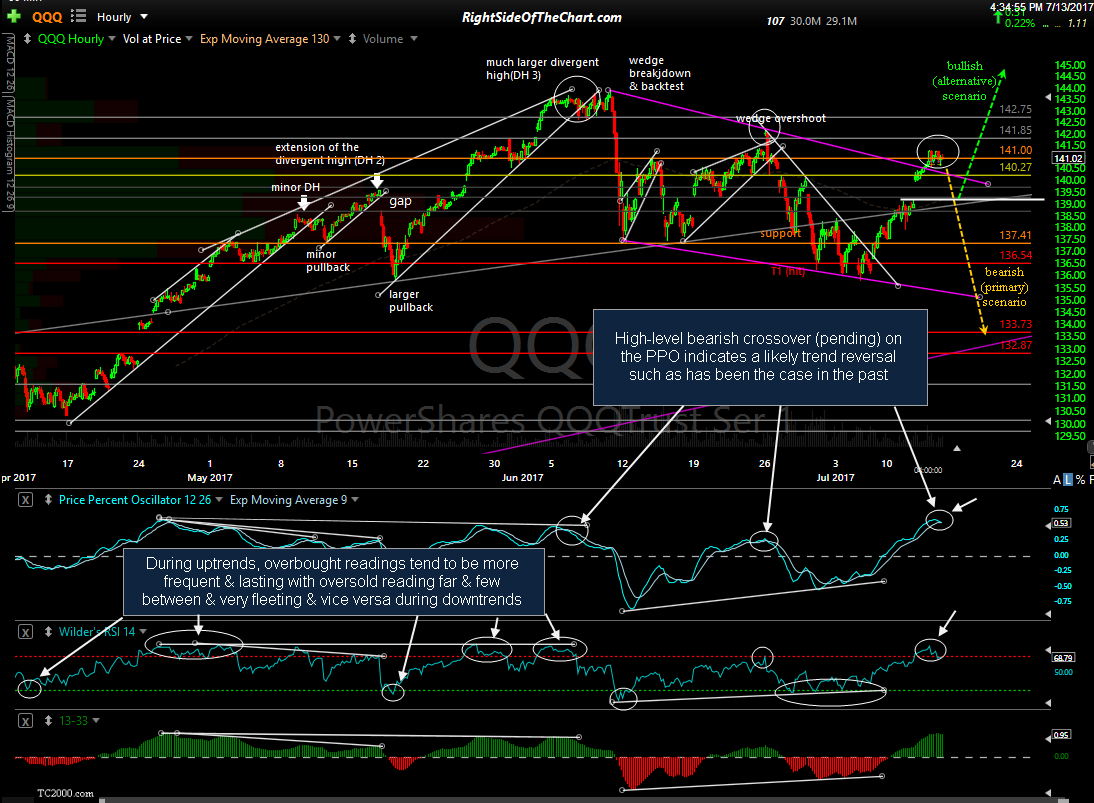
- QQQ 60-minute July 13th
-

- $NAA200R weekly July 13th

-

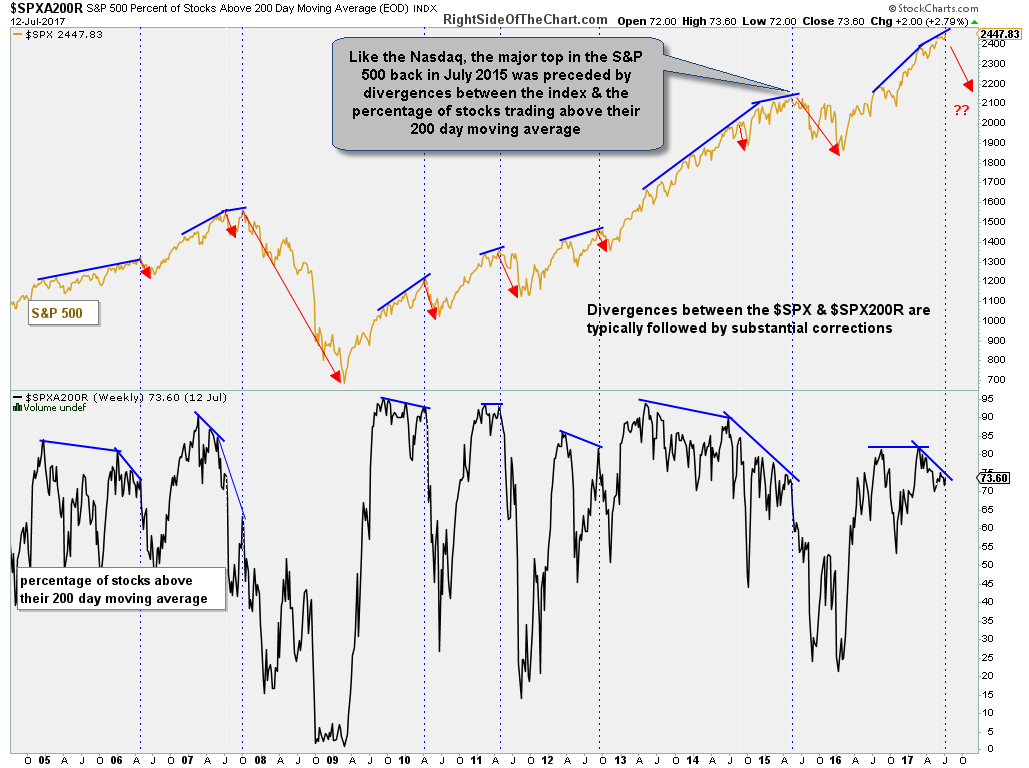
- $SPX200R weekly July 13th