
JJC (Copper ETF) will trigger a long entry on a CLOSE above this steep downtrend line. Stops TBD based upon entry price. Although one could certainly establish a starter position on an intraday break above the downtrend line or even here as spot copper prices are at long-term support on the weekly chart, with the amount of false breakouts & whipsaw signals lately, it might be best to wait to see JJC print a solid close above this steep downtrend line before establishing a full position.
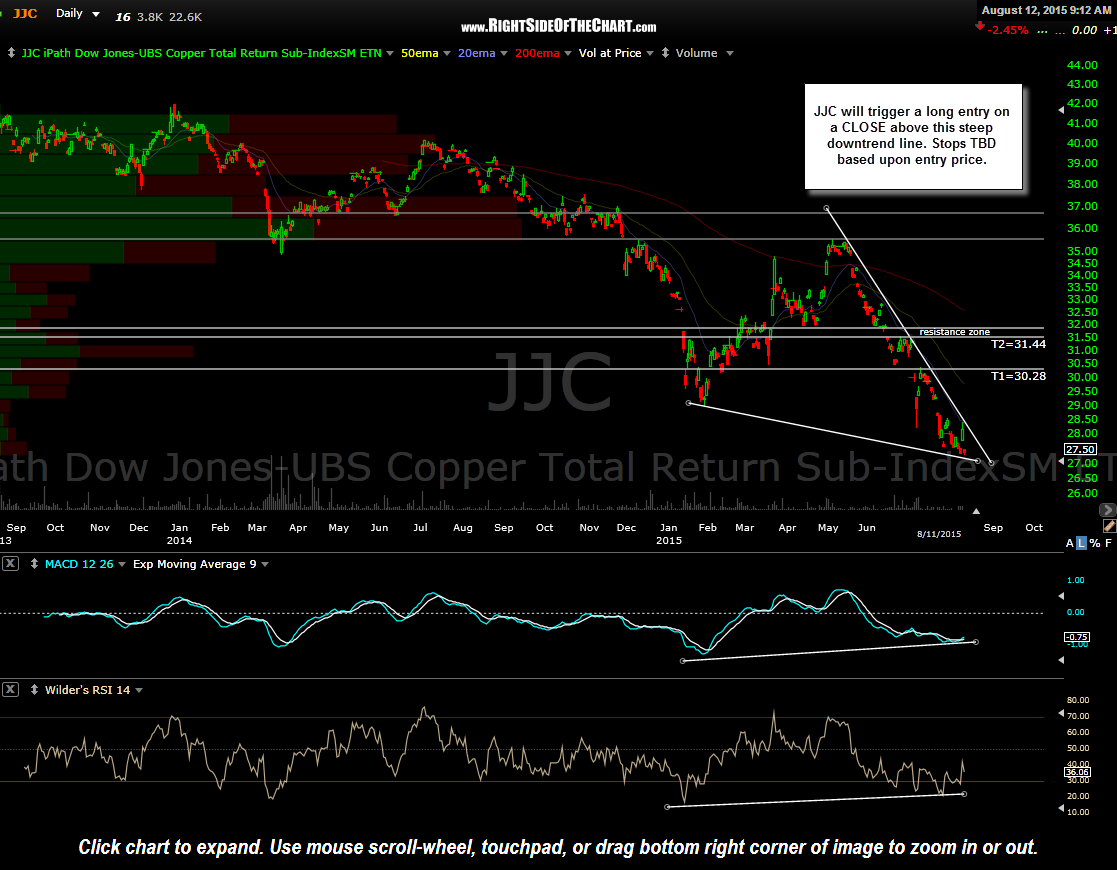
JJC daily Aug 12th
As with any trade, this one may or may not pan out but as far as my concerns about the effect that the slowdown in China might have on copper prices, my thoughts are that the impact is quite likely already reflected in the charts with copper prices already down 50% since the early 2011 highs. A link to the live, annotated version of the 10-year weekly $COPPER (spot copper prices) chart can be viewed here or under the Commodities & Metals section on the Live Charts page.
As copper prices have the potential to move up to the top of this weekly descending price channel and quite possibly eventually go onto break above it, which would be a very bullish technical event, $JJC will also be added as a Long-Term Trade idea with the potential for additional upside targets to be added if this setup triggers and entry & starts to play out as expected.
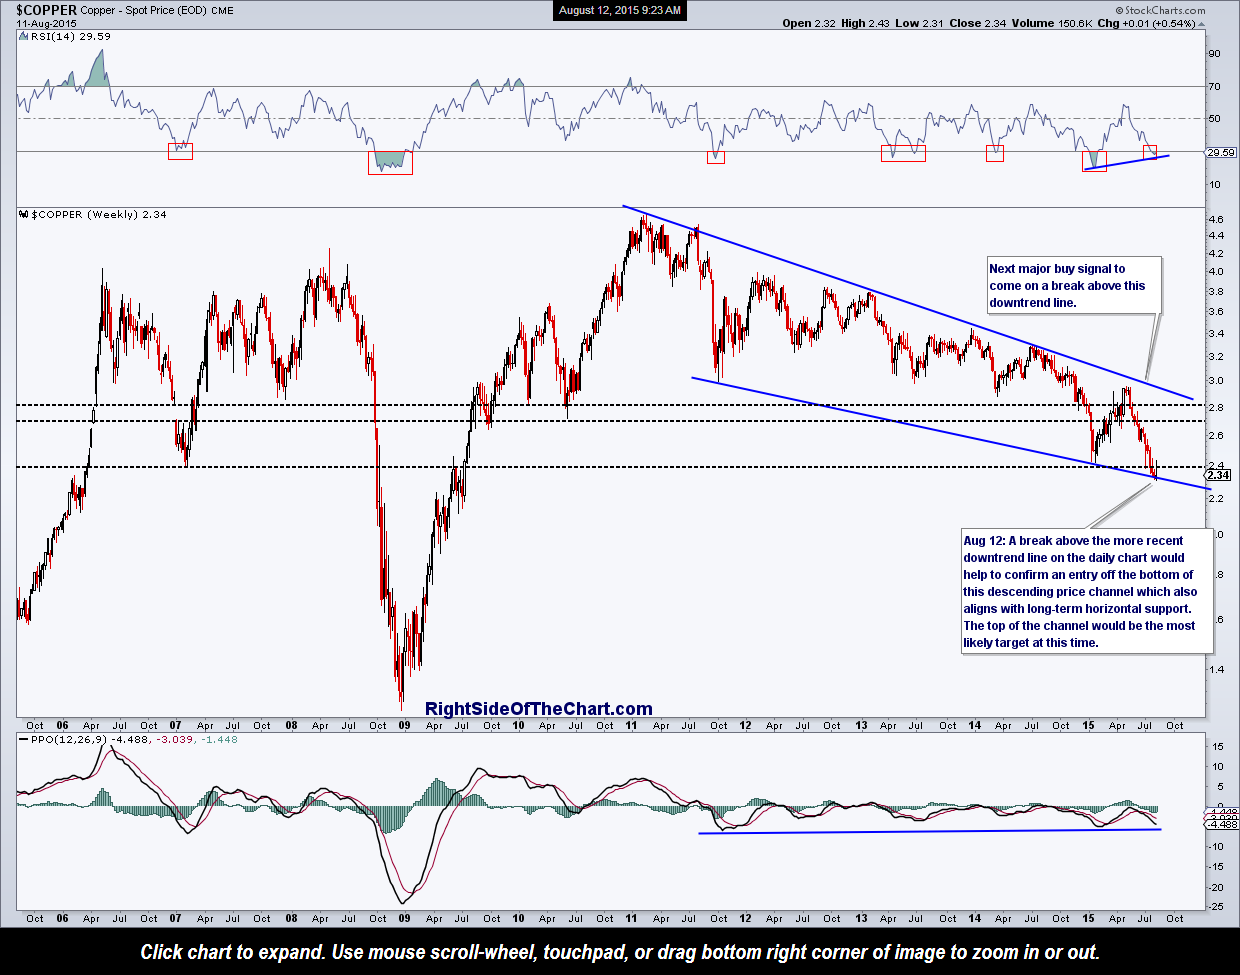
$COPPER weekly Aug 12th