
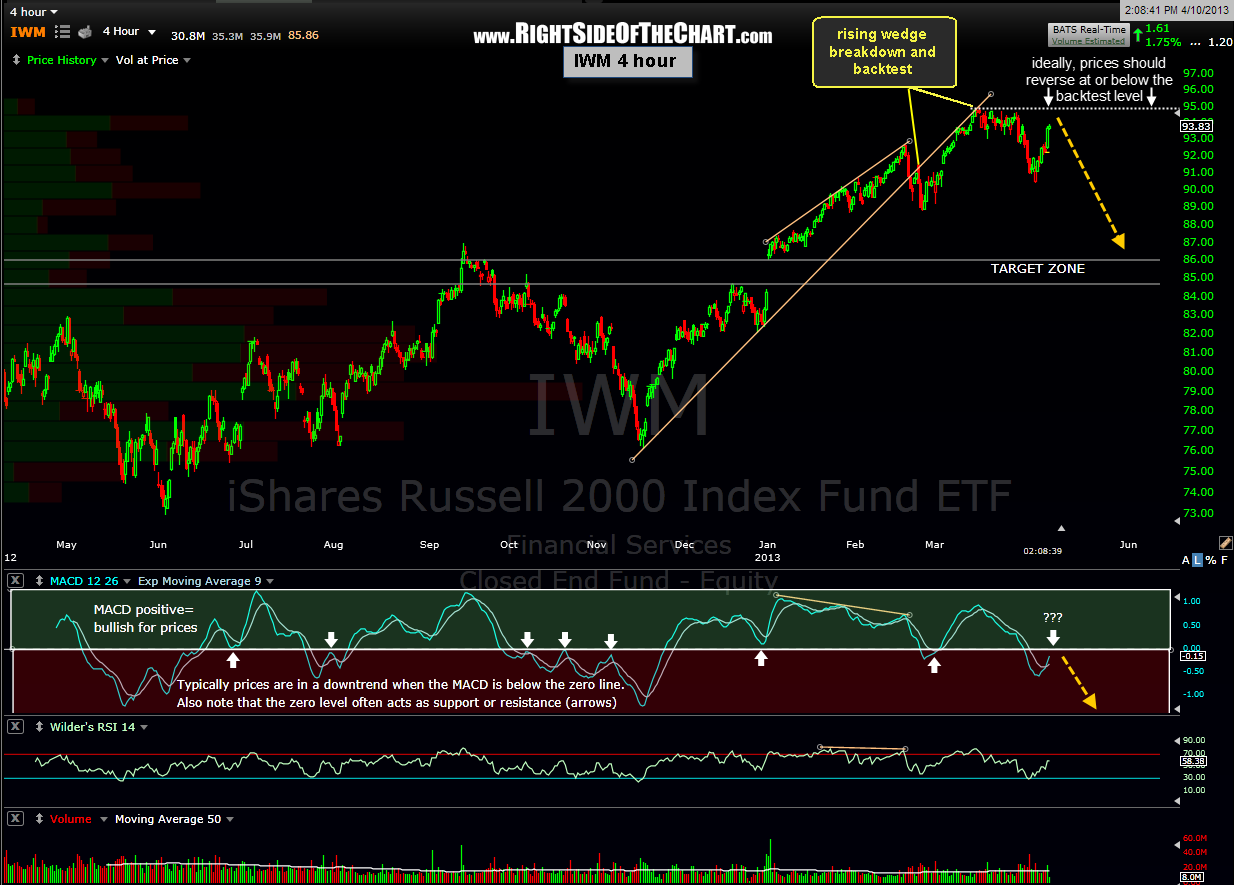
 A couple of things to watch for on the IWM trade. Looking at this 4 hour period chart to the right, keep an eye on the MACD. As most trraders know, any cross above or below the zero line is considered a bullish or bearish cross (not to be confused with the bearish cross-over of the MACD line over or under the signal line, as discussed in the previous post). For simplicity, I’ve shaded all positive values green and negative values red. What I often notice on many stocks and key indices as well is that once a bearish (or bullish) trend is underway, the MACD zero line often acts as support or resistance when tested from below (or above).
 Although not a perfect indicator (nothing in technical analysis is), the arrows on that 4 hour chart help to illustrate this phenomena. I also find it interesting that as the MACD quickly approaches the zero line from below, prices are also approaching the recent highs which is also the level at which IWM backtested the broken rising wedge pattern. As long as prices remain at or possibly just above this level (see notes on this 60 minute chart), the odds for the IWM trade to play out are still good IMO. However, if prices were to make a consider advance above the recent highs and regain that recently broken 60 minute uptrend line, then the IWM trade will have exceeded it’s stop parameter and prices will most likely continue higher.