
Not many technically significant events to report in the equity markets today although as I’ve have a few inquires regarding the recently highlighted pennant formation on the IWM (small cap ETF) 60-minute chart, I wanted to highlight the fact that price have started to move below the pennant. A couple of things to watch for to help confirm this potential sell signal in the small caps:
- A solid 60-minute close below the bottom of the pattern (1:00 pm EST will be the next 60-minute candle close).
- A move below the zero line on both the MACD signal line (9 ema) and the 13/33 ema trend histogram (i.e.- a bearish cross on the 13/33 ema pair)… all on the 60-minute time frame.
- Ideally, additional confirmation via sell signals on the SPY & QQQ (same 60-minute trend indicators as mentioned above).
Remember, as we are in the thick of earnings season and with over 90% of the largest companies reporting this week, volatility is likely to increase and with it, an increased rate of false breakouts/whipsaw signals. Best to keep things relatively light until the tail-end of next week unless we happen to get some very compelling buy or sell signals. Also make sure to be aware of when your current positions or potential trade candidates are scheduled to report earnings (a link to an earnings calendar is located under the ‘Tools of the Trade’ on the home page sidebar).
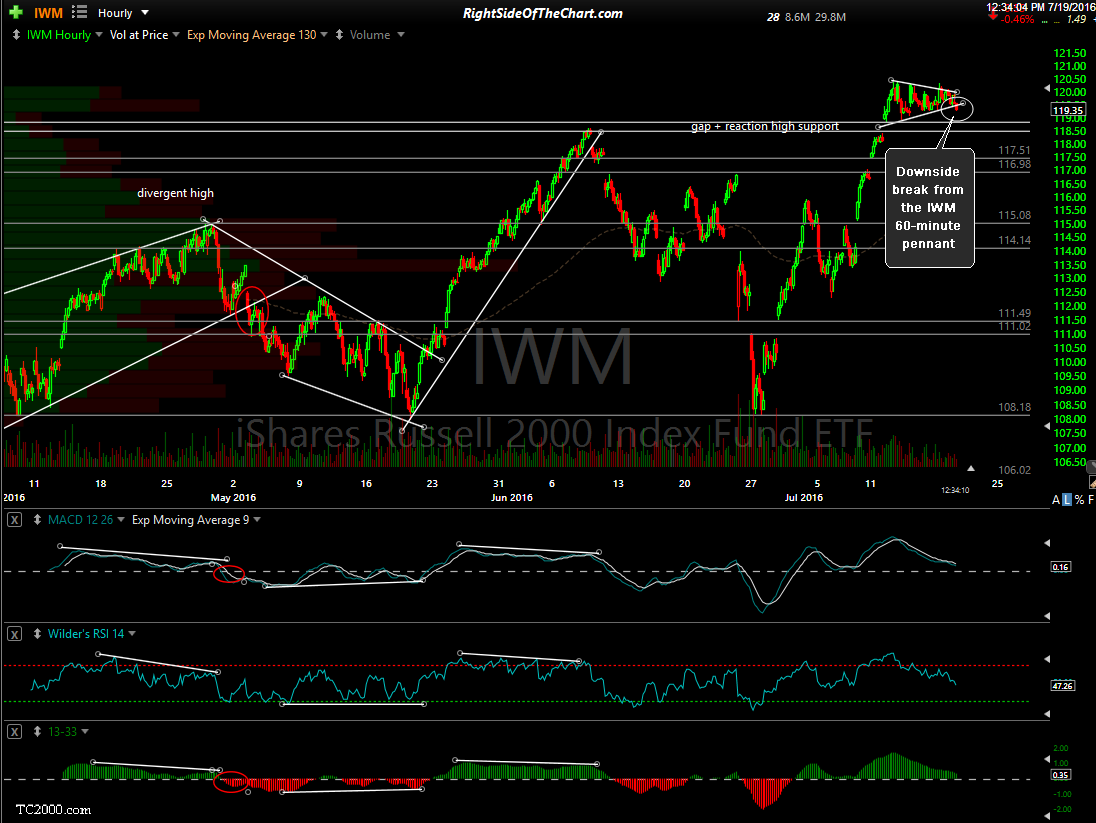
IWM 60-minute July 19th