
While the large caps already gapped below their near-term uptrend lines at the open, the small caps (IWM/$RUT) are currently testing their respective uptrend lines. This chart speaks pretty clearly IMO: A break above blue downtrend line would be bullish while a break below the rising wedge pattern (favored) would be bearish.
It is worth mentioning that when trading the small caps, or any other index for that matter, I always keep an eye on the leading large caps indices to make sure that a breakout or breakdown in the small caps is confirmed by a similar breakout in the large caps. In other words, I would not go long or short the small caps on a break above or below the key trendlines on this chart unless both the SPY & QQQ are also trading above(below) resistance(support) as well. On the flip side, before aggressively shorting or adding to a QQQ or SPY short, it would be prudent to wait for a breakdown in both the small caps and mid-caps ($MID/MDY), which have also moved down to a nearly identical uptrend line but have yet to break below.
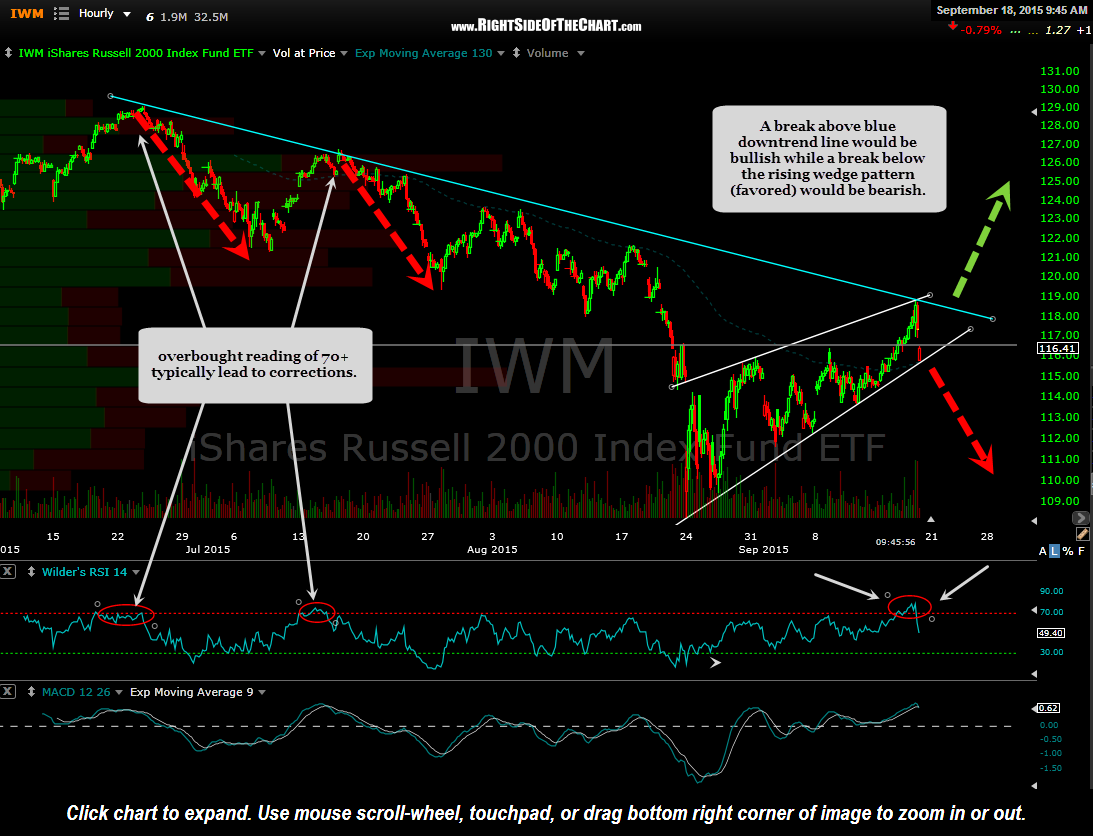
IWM 60 minute Sept 18th
As I often discuss, the initial reaction to FOMC announcements are usually very sharp & often reversed. In recent years, with the Fed’s heavy hand in the market, I find this to be more the rule than the exception. The white percentage scale to the right of this 1-minute period chart shows how much the Q’s rose & fell following the Fed announcement to hold rates steady.
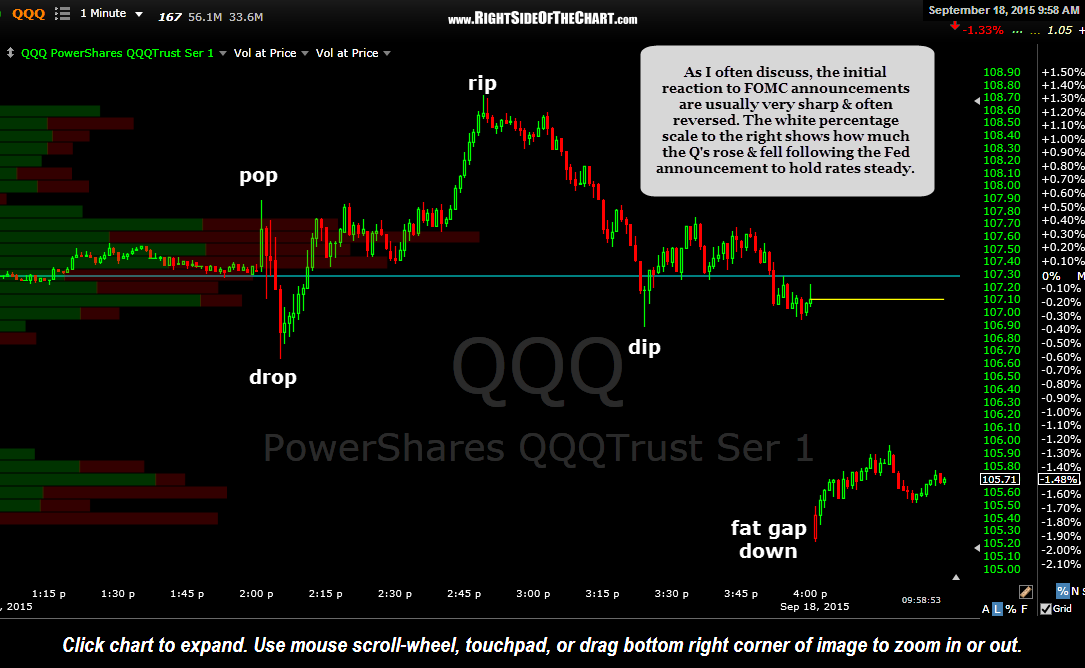
QQQ 1 minute Sept 18th