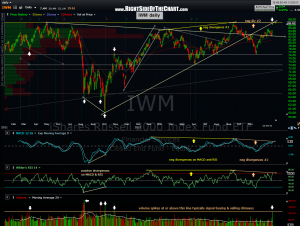
 As a follow-up to the $RUT weekly chart posted yesterday, here’s my interpretation of the IWM daily chart. The $RUT/IWM has been one of the strongest indexes over the last 6 weeks, retracing a full 100% of it’s Sept 14 – Nov 16th drop. All-in-all, unmistakably bullish price action. However, I call ’em like I see ’em, right or wrong & here’s what stands out to me when I look at the IWM daily chart:
- Double negative divergences now in place (as prices are now slightly above the 9/16 high) while both the MACD and RSI made lower highs. This follows the even larger divergences leading up to the previous highs on 9/16.
- Prices up against all-time high resistance. This is the third attempt at the 87 area on the IWM (approx. 870 on the $RUT) over the last two years. Although a solid breakout above that level would be bullish, the current overbought condition of the RUT/IWM makes any near-term breakout unlikely to stick. Ideally for the longer-term bullish case, the $RUT would consolidate for a few weeks before attempting a breakout of this level. Another bullish option would be a breakout soon with prices coming back to retest the 870 area with a decent consolidation there before powering higher.
- As with the weekly $RUT chart posted yesterday, prices are also backtesting a recently broken uptrend line.
- Finally, note the unusually large volume spike on the move into resistance yesterday. As the chart below illustrates, such volume spikes in the past were typically the result of a buying or selling climax.
Basically, the $RUT/IWM is at an important technical juncture. Any significant move higher will break out the index to new all-time highs (I’m not concerned with a few points here or there on a nearly 900 point index) while also likely negating, or undoing, the negative divergences that remain in place on both the daily and weekly time frames. Such an event would clearly be bullish, especially if accompanied on above average volume. As mentioned yesterday, we’d also need to see the more widely followed indices like the $SPX, $NDX, $COMPQ, etc.. to confirm by also breaking above their 2012 highs. While the $SPX is getting close, the $NDX & $COMPQ still have quite a bit of work to do.
As I’m winding down my vacation, I plan to sit down over the weekend and do a comprehensive look at the charts. I also plan to update the trade ideas by removing any completed trades as well as adding any new trade ideas that I come across. Once again, I hope that you enjoyed the holiday season and I want to wish a very Happy New Year to all!!!

