
Let’s take a look at the charts of gold from a top-down approach, starting with the weekly chart. As mentioned in some of the previous updates on gold, a solid weekly break & close below the long-term uptrend line on the weekly chart of $GOLD (spot gold prices) would likely open the door for a move down to test the mid & late 2013 lows in gold prices. With $GOLD closing slightly below that uptrend line last week and, barring a very sharp rally into the close tomorrow, it looks like $GOLD will print another weekly close below that key support level, hence, I remain open to the possibility of additional downside in gold before any meaningful reversal. I had also previously stated that because so many eyes are on that mid & late 2013 double bottom, that I wouldn’t be surprised to see gold either reverse just shy of that level or to break below that level (either intra-week or for up to a few weeks) in order to shake out the last of the weak hands via a bear trap/flush-out move before a lasting bottom is put in place in the shiny metal. Of course that is making the assumption that the bear market in gold that began in Sept 2011 has run its course and that it was just another cyclical bear market within a much larger secular bull market in gold that has more room to run. Only time will tell if that proves to be the case but one of the factors that keeps me in the longer-term bullish camp on gold at this time (other than fundamentals) is the fact that even if we do take out the mid/late 2013 double bottom lows, gold prices have a very, very long way to fall before negating (i.e.-undoing) the very powerful bullish divergences that would remain in place on both the weekly PPO (similar to the MACD) and the RSI, as well as several other long-term price & momentum indicators and oscillators.
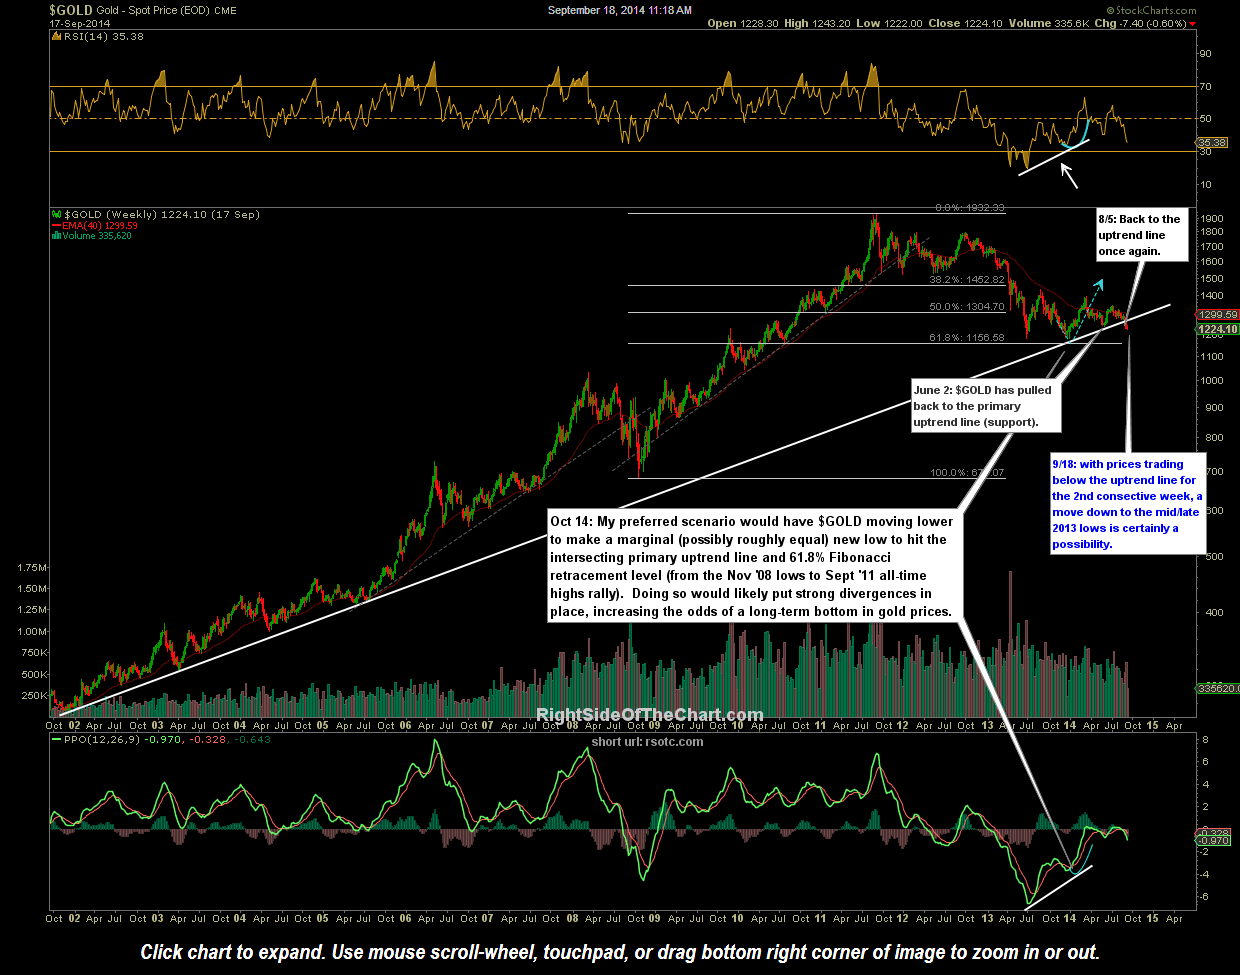
$GOLD weekly Sept 18th
Moving down to the daily time frame on GLD (Gold ETF), a case can certainly be made that, at the very least, the chances for a short-term bounce in gold are quite elevated at this time. Although this chart only shows 2 1/2 years of price history, if you look back over a decade on a daily chart of GLD you will see that, without fail, every single time the RSI 14 moved below the 30 (oversold) level, a sharp reversal (bounce) in gold began almost immediately (or within just a couple of weeks in a few rare instances). These bounces ranged from short-term (days to weeks), intermediate-term (weeks to months), and long-term (years). As this daily chart shows, GLD is currently oversold while also backtesting the primary downtrend line that is generated off of the 2012 highs. Keep in mind, of course, that oversold can & often does become “more oversold” & therefore, oversold in itself should not be used as a stand-alone buy signal and/or exact timing indicator.

GLD daily Sept 18th
Zooming down to the 60-minute time frame on GLD, the previously posted bullish falling wedge pattern has been extended as GLD has continued to move lower since the previous update. It is also worth noting that the bullish divergences below the wedge are still very much intact and have only increased in scope since the previous updates. Over the last few sessions, GLD broke below the aforementioned 199.50ish support level (drawn as a support zone on the previous charts) and made two perfect kisses (backtests) of that zone below before moving sharply lower. Note that the large red candlesticks following that rejection off of the bottom of the support zone also came on high volume (tall red volume bars). Such price & volume action is typical of near-term capitulation and often results in at least a minor counter-trend rally.

GLD 60 minute Sept 18th
Bottom line: A case can certainly be made that at least a near-term, oversold bounce in gold is likely at this point in time. Of course the near-term trend in gold is unarguably bearish so any short-term long-side trades in gold or the miners remain counter-trend, aggressive trades at this time. Looking out further, I think that IF a bottom in gold is close or already put in (mid/late 2013 lows), then gold is likely to either reverse just above those level (as in anytime now) or on a washout move following a break of the mid/late 2013 lows. I’m not exactly sure how low or long such a wash-out move would last but for now, I’m still holding off on increasing my long-term exposure to gold, silver & the mining stocks and may or may not take another shot at a short-term trade on GDX again here soon after stopping out on the recent short-term trade based off the 15 minute chart. (We now have bullish divergences forming on the GDX 60 minute time frame as GDX flirts with the 23 level, which is decent horizontal support).