
After recently kissing the top of the Ascending Broadening Wedge (ABW) pattern, GLD has now fallen back to the bottom of the pattern which may act as support. Any solid and sustained break below the pattern could have longer-term bearish implications for gold. However, it is worth noting that GLD ($GOLD) also has significant horizontal support just below around the 114.50 area (1180 area on $GOLD) which was defined by the 2013/2014 triple-bottom lows.
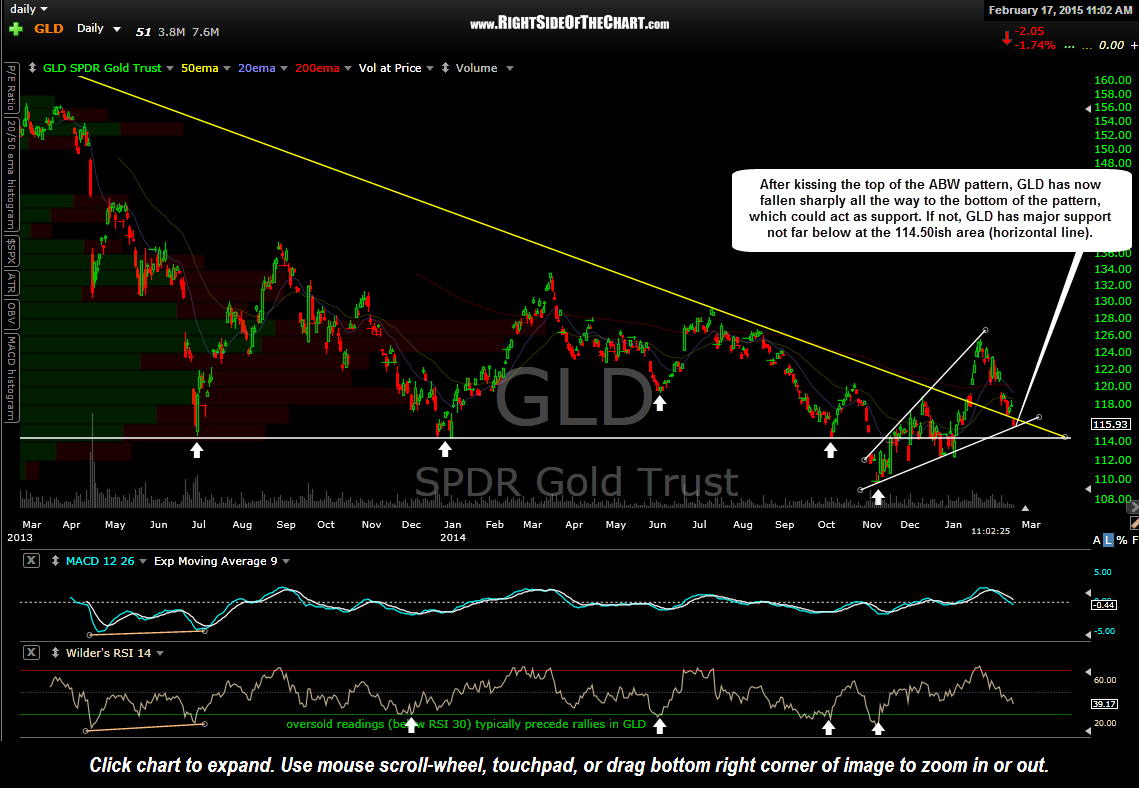
GLD daily Feb 17th
It is also worth noting that GLD/$GOLD is currently backtest the primary downtrend line which is generated off of the Oct 2012 highs, one other potential support level. As stated in the Jan 28th Precious Metals & Mining Video, I said that I would be concerned if the pullback in gold following the Inverse Head & Shoulders (IHS) pattern breakout were to come all the way back to the neckline, which has now happened & then some. My concerns remain and at this point, although still long positions in gold & the miners from last week, I do not plan to add any more exposure to the PM sector unless/until I see something in the charts that convinces me to do so.
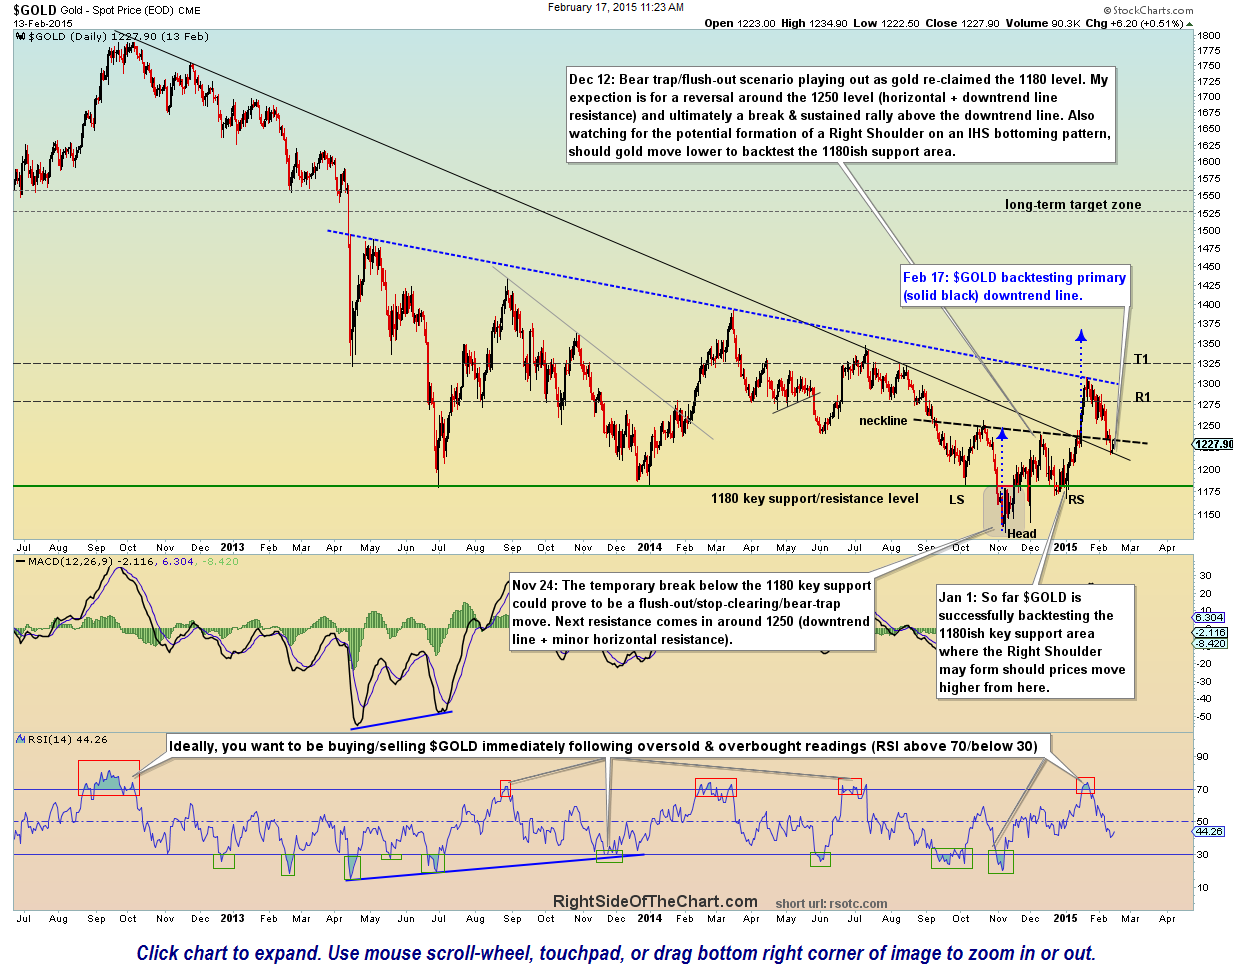
$GOLD daily Feb 17th
Zooming down to the 30-minute timeframe on GLD, despite today’s drop, GLD still has potential bullish divergences forming at this time. By my criteria, those divergences will only be confirmed should be get a bullish crossover on the MACD if and when we get a bullish crossover on the MACD, assuming that the crossover occurs with the MACD forming a higher low (vs. the previous low at the beginning of the uptrend line drawn below on the MACD).
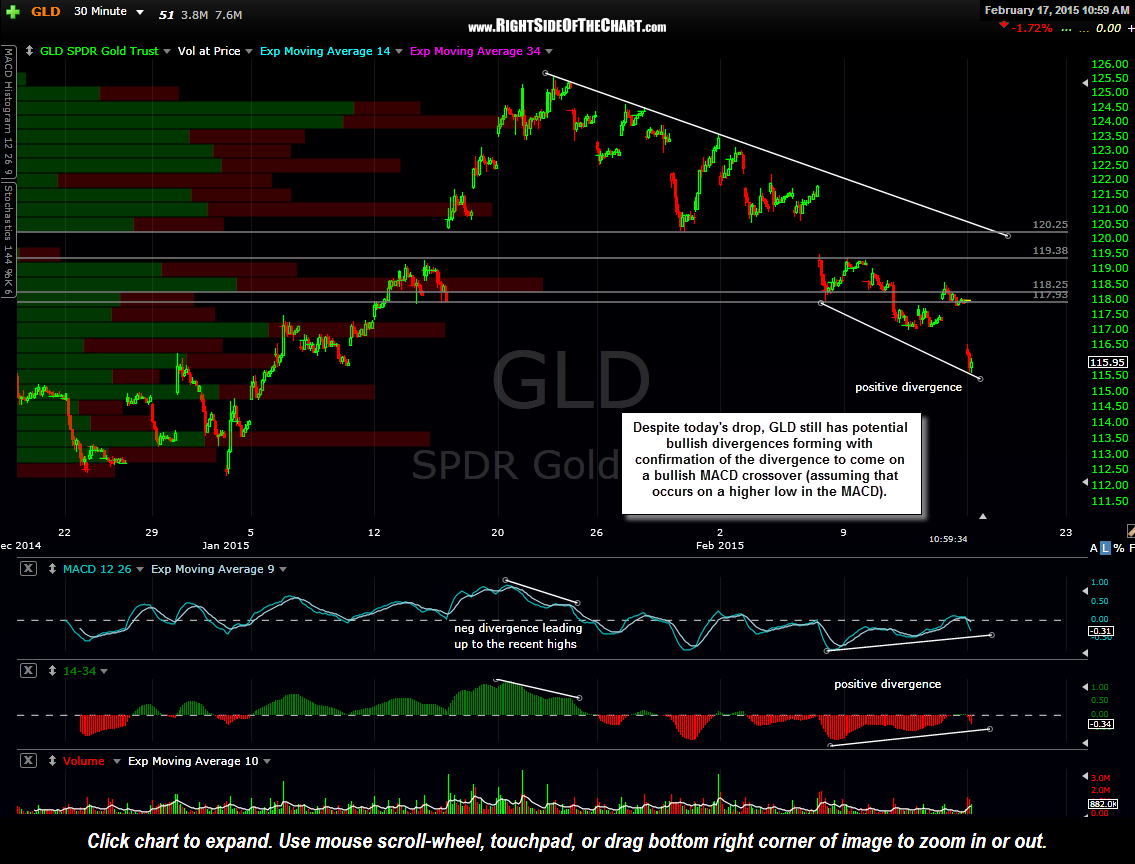
GLD 30 minute Feb 17th