
With most of the major global equity indices recently breaking below key uptrend lines and/or bearish chart formations, complete with negative divergences in place, the U.S. markets are most likely not far behind. Most of these chart were published in the August 6th “Around the World in 60 Seconds” post and live versions of many of these charts, along with the major US indices not shown here, can be found under the Live Charts page. Remember, despite the apparent resiliency of the US markets, we are still just a bad day or two away from smashing through the primary bull market uptrend lines (generated off the March 2009 lows) on both the S&P 500 & S&P 100 as well as the Nasdaq Composite & Nasdaq 100 while both the small caps (both the Russell 2000 & S&P 600 Indexes) as well as the mid caps (S&P 400 Mid-Cap Index) have already just recently broken below their primary bull market uptrend lines. If & when all major US equity indices have ALL fallen below their respective bull market uptrend lines, all of the ingredients are in place for a very swift and powerful decline so regardless of how many times you have heard that over the last few years, just make sure to have a trading plan in place whether you are bullish or bearish.
-

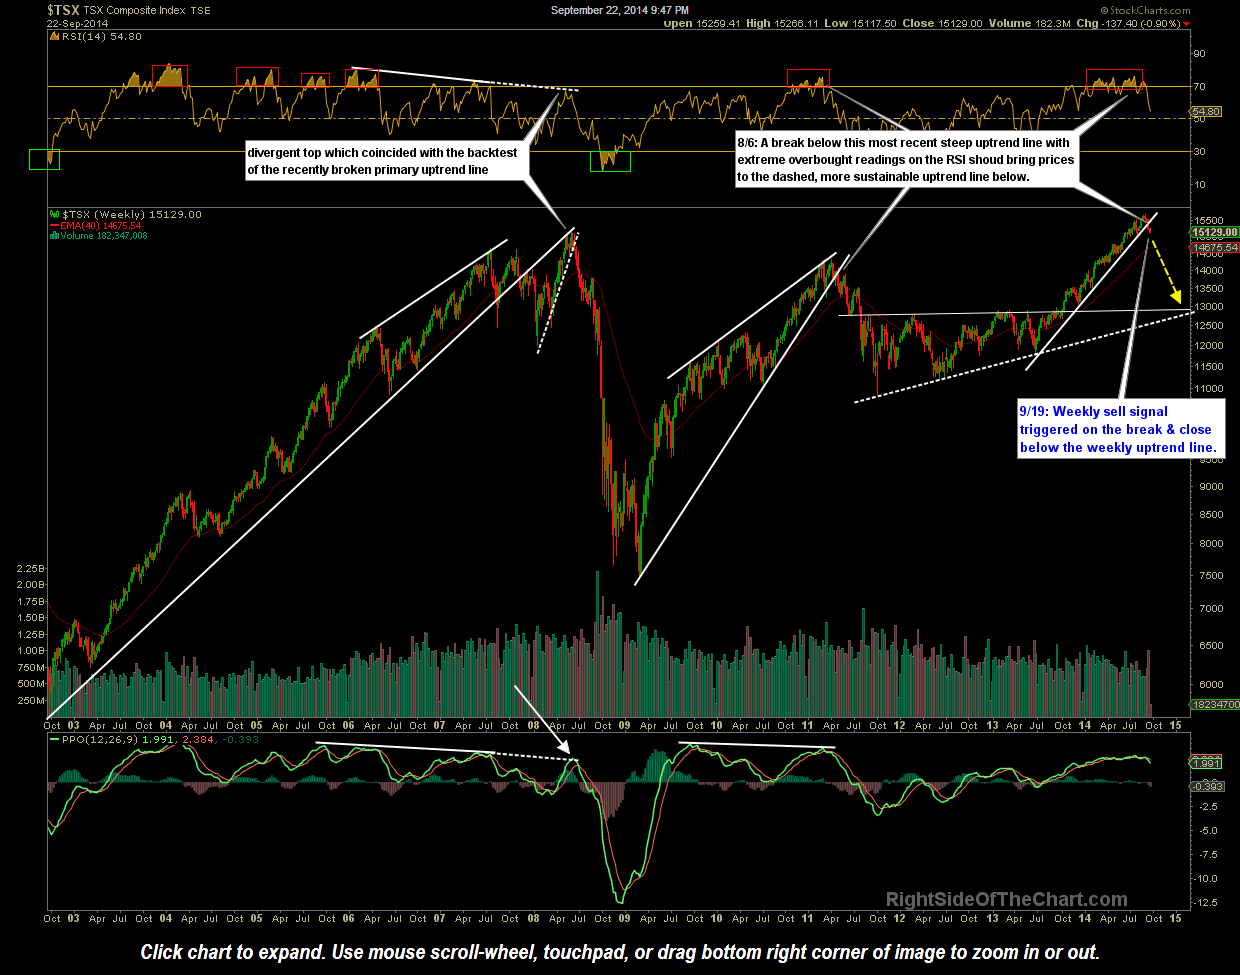
- $TSX weekly Sept 22nd
-
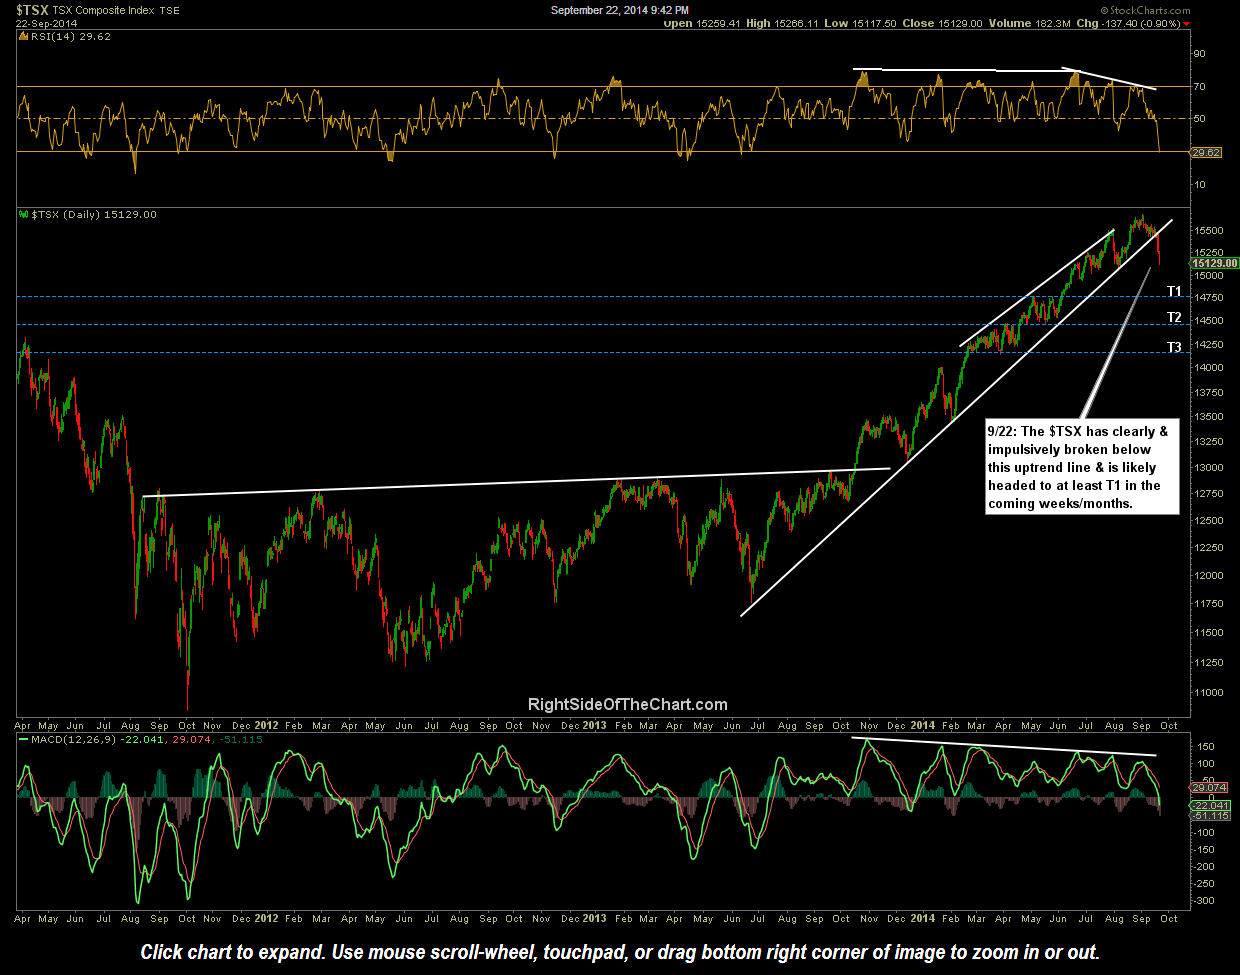
- $TSX daily Sept 22nd
-
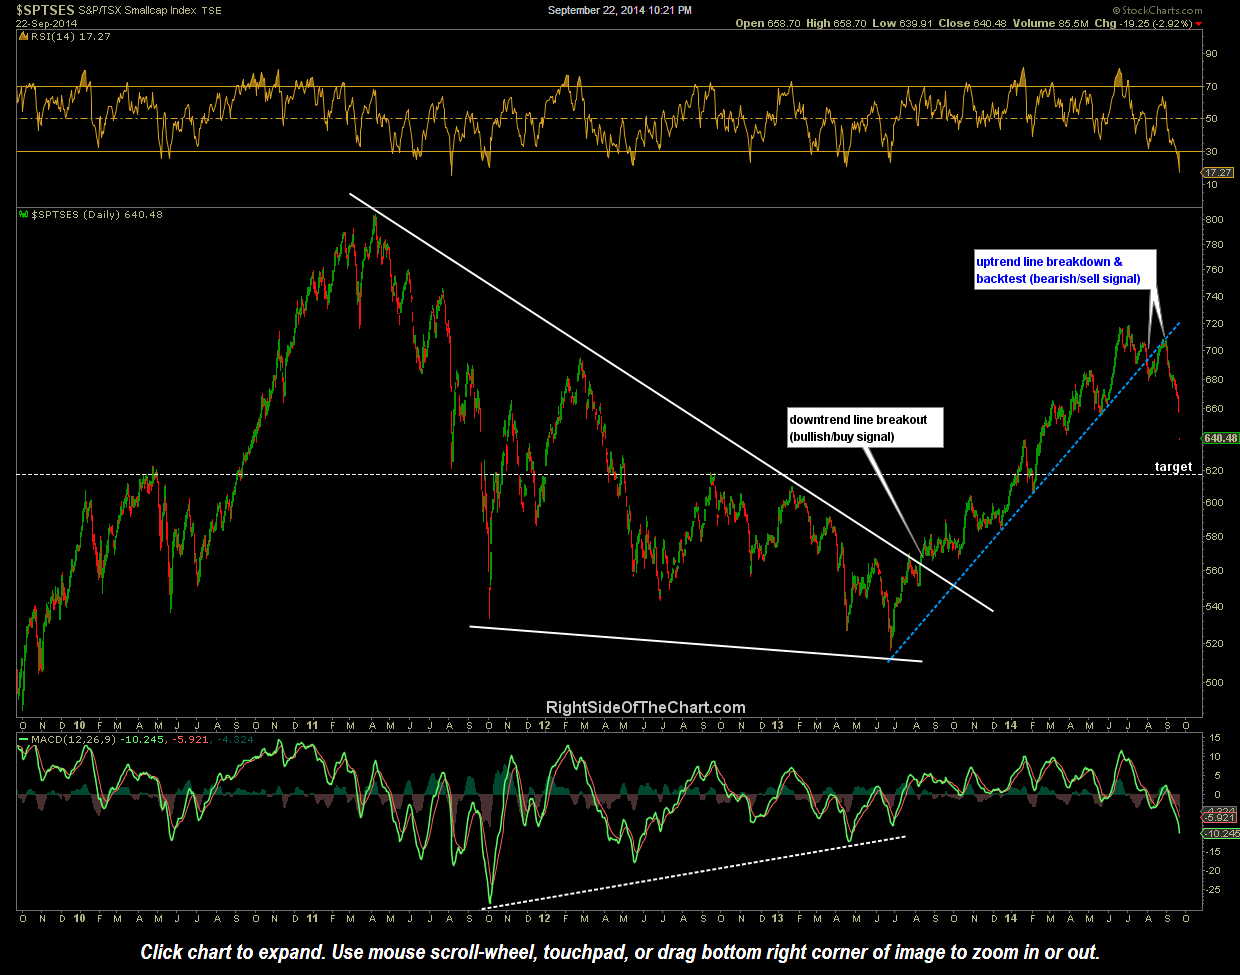
- $SPTSES TSX Small Cap Index
-
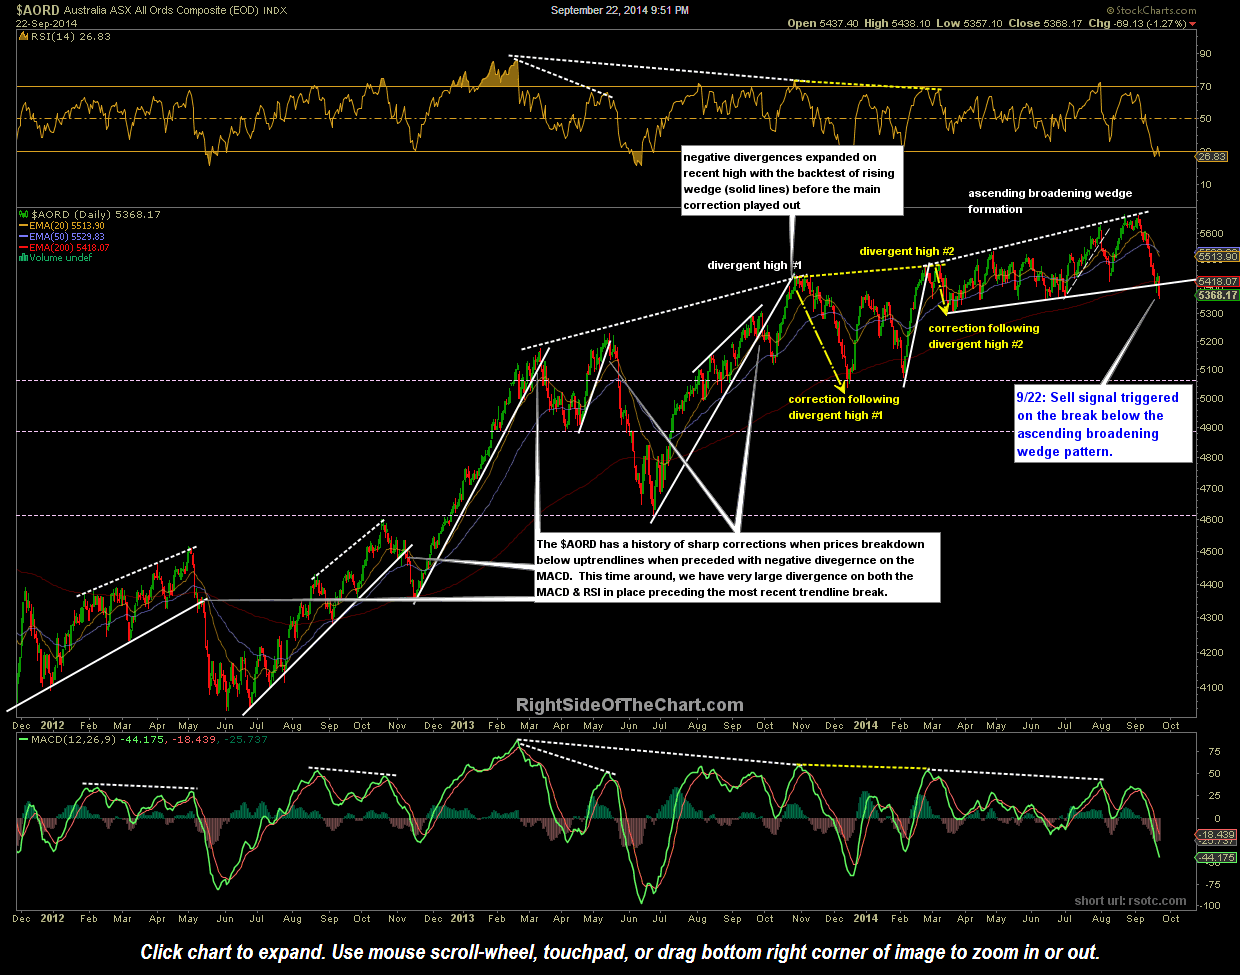
- $AORD daily Sept 22nd
-
- $FTSE daily Sept 22nd

-
- $DAX daily Sept 22nd

-
- $CAC weekly Sept 22nd

-
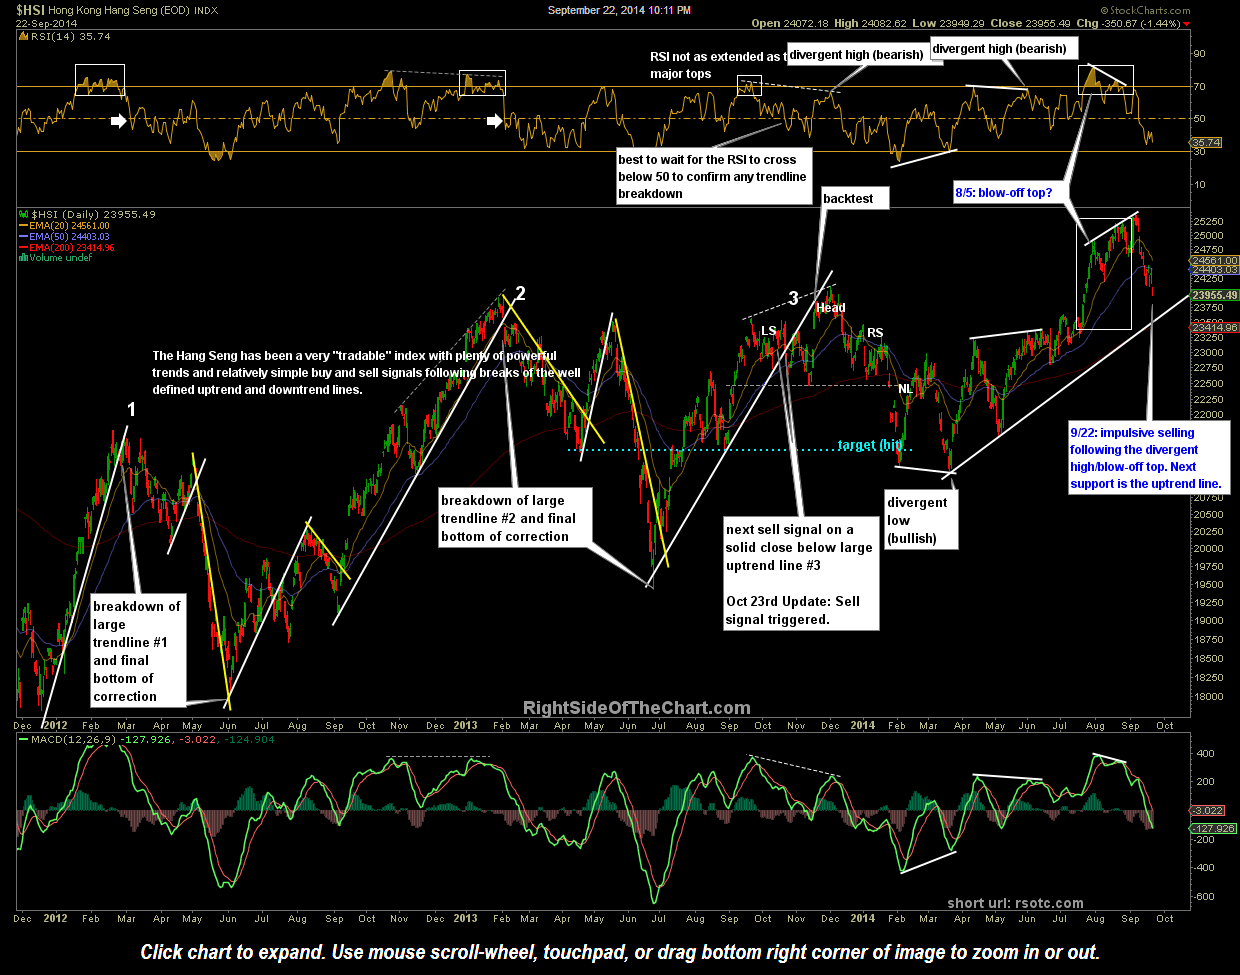
- $HSI daily Sept 22nd
-
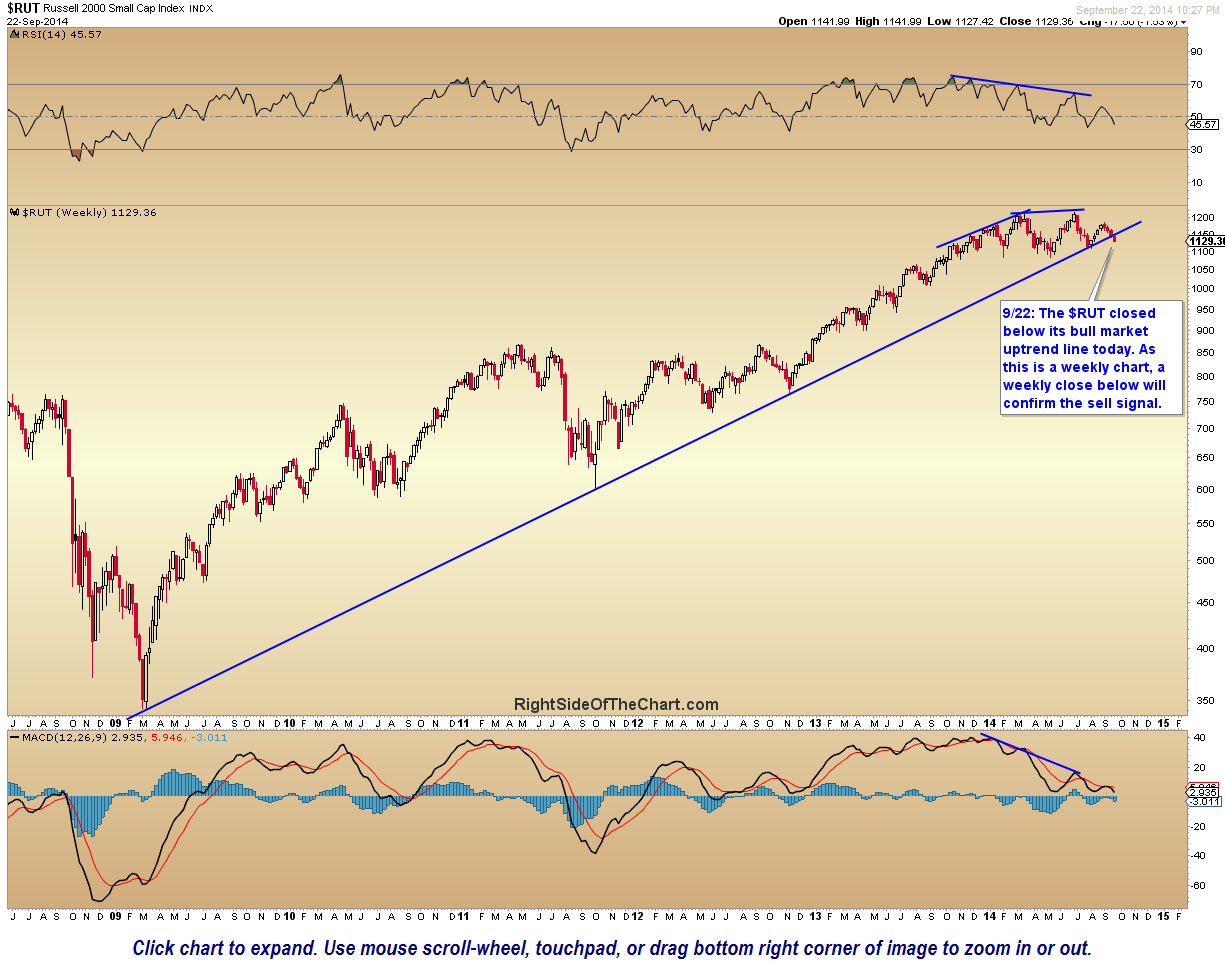
- $RUT weekly Sept 22nd
While my personal trading activity has been extremely light lately and hence, very few new trade ideas or broad equity market analysis, I have started working on update the trade ideas and plan to remove any stopped out trades along with those that no longer look very compelling in order to add some new trade ideas. For now, I’m still giving gold & the miners as well as the agriculture ETFs a little more room as those are intended as Long-Term Trades/Investments although I continue to prefer to wait for decent evidence of a reversal before adding any more exposure into any of those positions.