
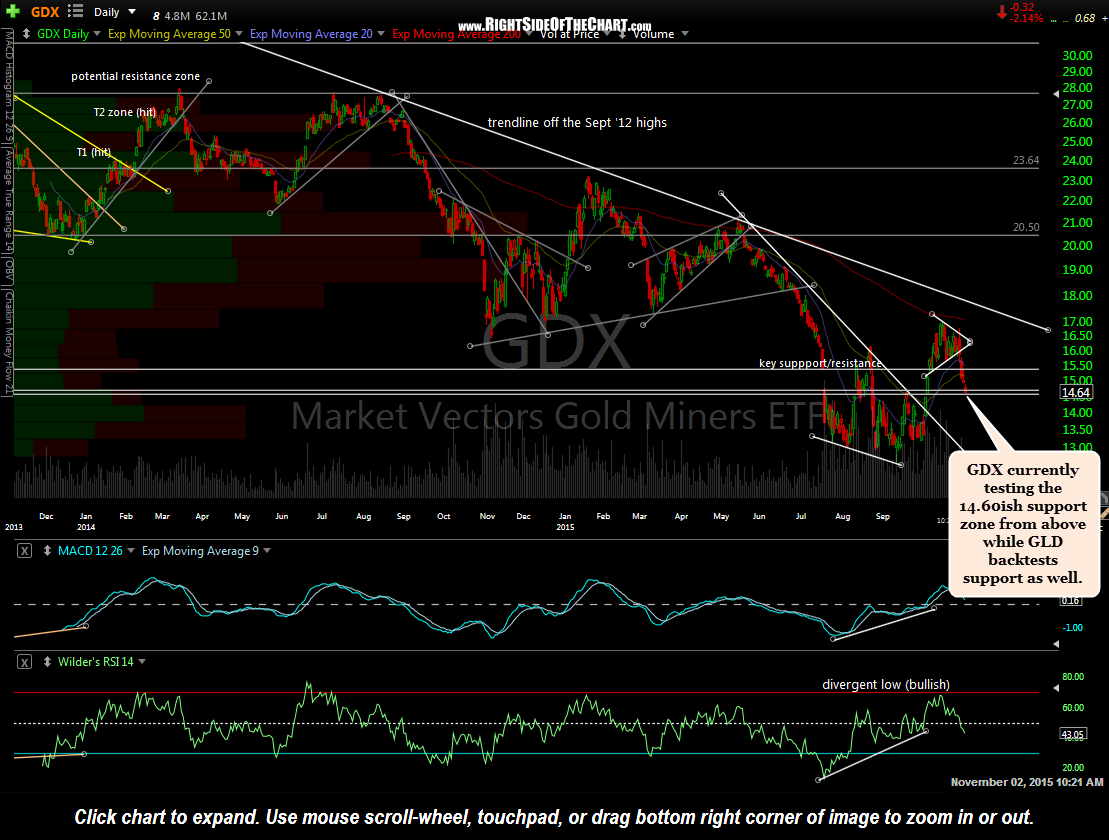
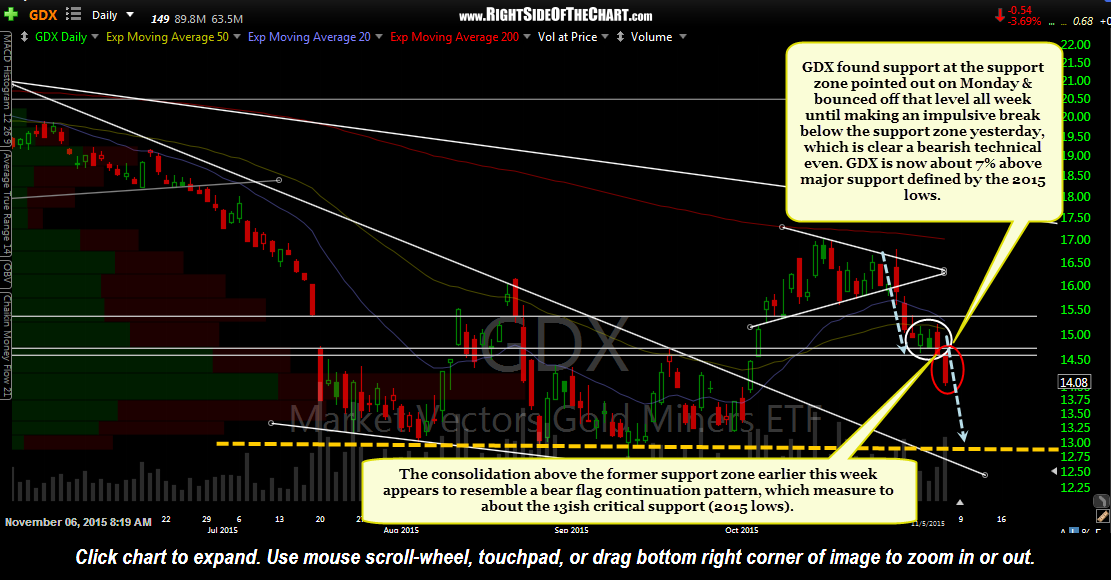
I’ve received several inquiries regarding the outlook for gold (GLD) and the miners (GDX) recently. On Monday, it was pointed out GDX had fallen to a decent support zone (first chart below) where the miners did indeed find support, immediately bouncing off that level following that update & continuing to find support for the next few days. However, GDX broke below that level yesterday & prices moved impulsively lower, a clearly bearish technical event. In fact, the consolidation above that support zone earlier in the weekly resembles a bear flag continuation which measures right about to the 13ish level which is critical support defined by the 2015 lows. While I don’t have any intention or desire to short the miners at this time, I would have to say that until/unless GDX can move back above the 15.50 level, the near-term bias is clearly bearish.
-

- GDX daily Nov 2nd
-
- GDX daily Nov 5
As far as gold (via GLD), it is still trading somewhat comfortably above it’s 2015 lows although every time gold looks to be getting some traction to the upside by break above some downtrend line or other well-watched resistance level, the selling seems to kick in with full force, completely unwinding any bullish technical developments as if they never occurred. GLD did close at a decent (but not major) support level yesterday but as with the miners, I’m just watching for now as day trading & short-term swing trading DUST & NUGT continue to be the only viable option for engaging the mining sector right now (investors, typical swing traders or trend traders, long or short, would have gone nowhere holding the miners for the last four months now).
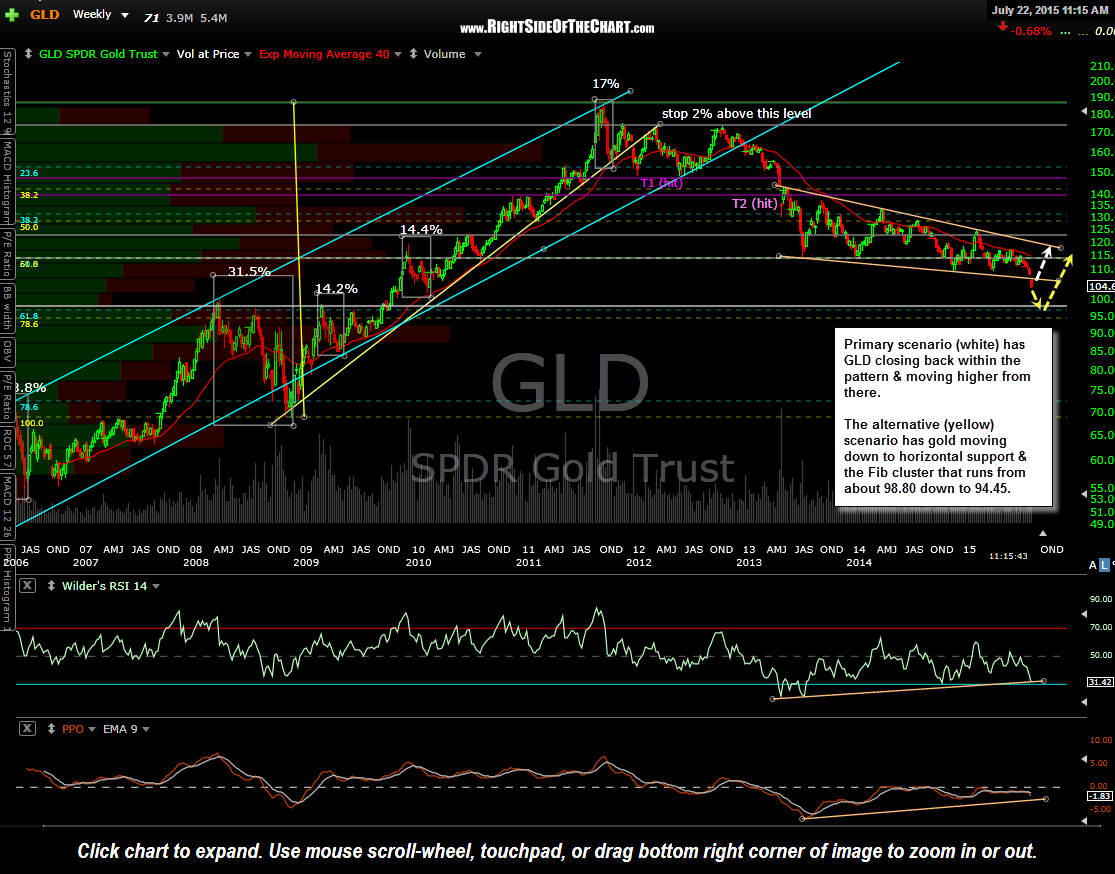
In this first weekly chart of GLD posted back in July, I listed the two most probable scenarios for GLD. My primary scenario at the time had GLD reversing off the bottom of that multi-year descending & contracting channel after that brief whipsaw break below (I’ve adjusted that lower TL since), which is exactly what it did, providing some very profitable trades for us in the miners back then. However, that bounce in GLD ended about ¾ths of the way toward the top of the pattern, actually stopping cold at those overlapping Fib retracement levels (blue & yellow dashed lines, 50 & 61..8% retracement levels).
-

- GLD weekly July 22nd
-

- GLD weekly Nov 5th
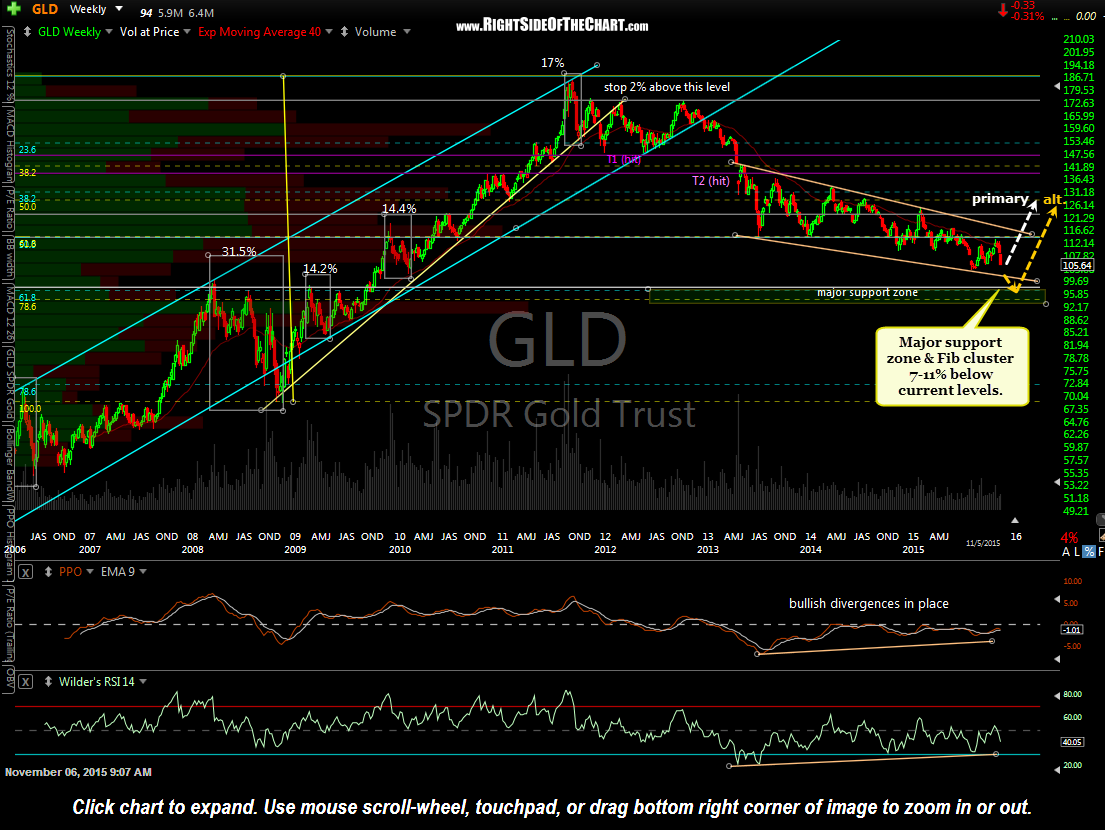
Where do we go from here? Basically, I could flip a coin on whether my primary scenario from July (which remains my primary until/unless the July 24th lows in GLD are taken out) or my alternative scenario (a move down to the 98.80-94.45 major support zone on the weekly chart) plays out. In other words, I am unclear on the very near-term outlook for GLD & GDX but remain longer-term bullish with the possibility of another 7 to 11% downside in GLD.