
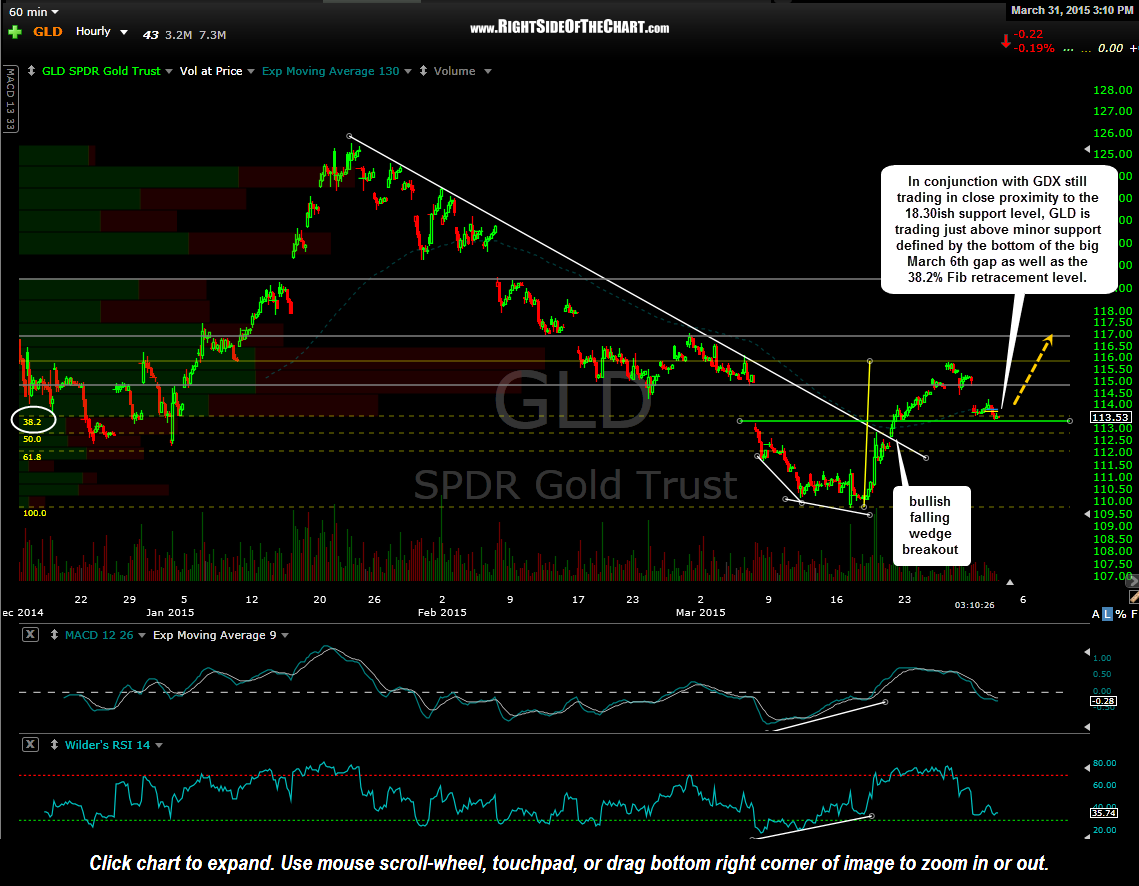
GLD 60 minute March 31st
I often harp upon the fact that the miners are essentially akin to a leveraged trade on gold prices, meaning that if gold goes up or down X, the mining stocks are likely to go up 2, 3 or even 5X. I was just corresponding with a friend by email that is currently short the miners, expecting a downside move to about the 18 area. This is my email reply to him that summarizes my thought on the GDX/DUST trade as well as gold price (via GLD). Remember, barring the occasional brief disconnects between the nearly perfect correlation between the two, where gold goes will also determine where the miners go. Therefore, I never trade the mining stocks without one eye on the charts of gold.
my reply: Thanks for sharing that…. Good points. 18 may very well be in the cards & should provide decent support. In fact, if you look at that 15 minute GDX I posted today, you’ll note a very large bar on the VAP histogram. On the flip side, we just finished backfilling a thin zone on that VAP histogram and the bars start to increase significantly from here.
The 18 level is about in line with a 3:1 R/R on the average cost for the two GDX swing entries (at the TL yesterday at 18.48 & the 18.30 horizontal support today, avg cost of 18.39. GDX, like gold, seems to love fake-out moves lately so my best guess, fwiw, is a gap up & run tomorrow, catching both shorts & wanna-be longs off-guard, with the 18.80 near-term target being hit tomorrow or Thursday. Just a guess of course but there’s more than that going into my take, including the fact that gold is trading just above minor support (bottom of the huge 3/6 gap PLUS gold (which determines where the miners go) has only retraced a hair over 38.2% Fib retracement from the move off the lows… perfectly healthy corrective action so far, despite the strong correction in the miners, which is typical as they rise and fall much harder than gold. Again, JMHO & g-luck on the trade.
The attached chart is a 60-minute time frame of GLD. The white trendlines show the previously highlighted bullish falling wedge patterns with positive divergences preceding the breakout which occurred on March 20th. This correction that began after GLD peaked on Thursday is the first correction that GLD has made since bottoming on March 17th. Although this could be the start of a much deeper sell-off, at this point my take is that this is just a normal, healthy near-term overbought pullback in GLD which at this point, has only pulled back to the 38.2% Fibonacci retracement level (Fib lines in yellow) of that rally from the March 17th lows, a common end-point for corrective moves.
Again, anything is possible so trade according to your own abilities, risk tolerance and comfort levels and make sure to use appropriate stops and positioning sizing, especially if trading the very volatile mining stocks. Longer-term investors with a bullish outlook on gold & the mining sector could also take advantage of this volatility to use a scale-in approach by strategically accumulating small lots in GLD, GDX or individual mining stocks on pullbacks to support, again with stops set according to one’s average cost basis and potential target level(s).