
After closing at the top of the triangle pattern yesterday (30 minute chart), GDX moved lower to close at the bottom of the pattern today. An upside or downside resolution is likely to come tomorrow or by Wednesday, latest. As is typically the case during symmetrical triangle patterns, the price & momentum indicators & oscillators aren’t providing many clues as to which way the pattern will break. I’m leaning towards an upside resolution of the pattern but might pass or just take a partial position for a trade if we get an upside breakout of the pattern as the FOMC decision on Wednesday is almost certain to cause a very fast rip or dip in both the US Dollar and gold.

GDX 30 minute 2 Oct 26th
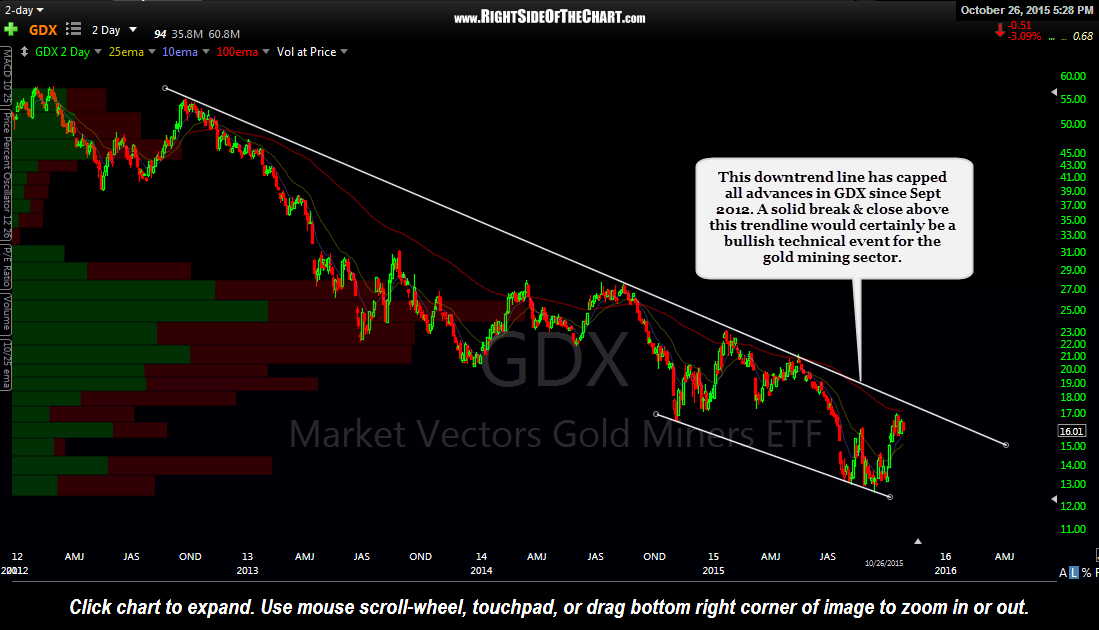
Zooming out to the daily time frame, that symmetrical triangle pattern also has the appearance of a large bullish pennant formation, with a measured target to roughly the 20.50 horizontal resistance level. However, if even GDX does make a solid break above the pattern it would likely find resistance at the downtrend line generated off the September 2012 highs. A solid break & close above this trendline would certainly be a bullish technical event for the gold mining sector.
-

- GDX 4-year, 2-day period Oct 26th
-

- GDX daily Oct 26th
