
As I often try to impress that, barring the occasional brief disconnects, the gold mining stocks will follow the shiny metal (gold). As this 2-hour period chart of GLD highlights, GLD has been riding along the bottom of the aforementioned ascending broadening wedge pattern over the past several trading sessions. While a solid break below the pattern would be bearish for gold, my preferred scenario is a breakout above the yellow downtrend line, followed by a move up to at least the resistance zone defined by those two recent large gaps.
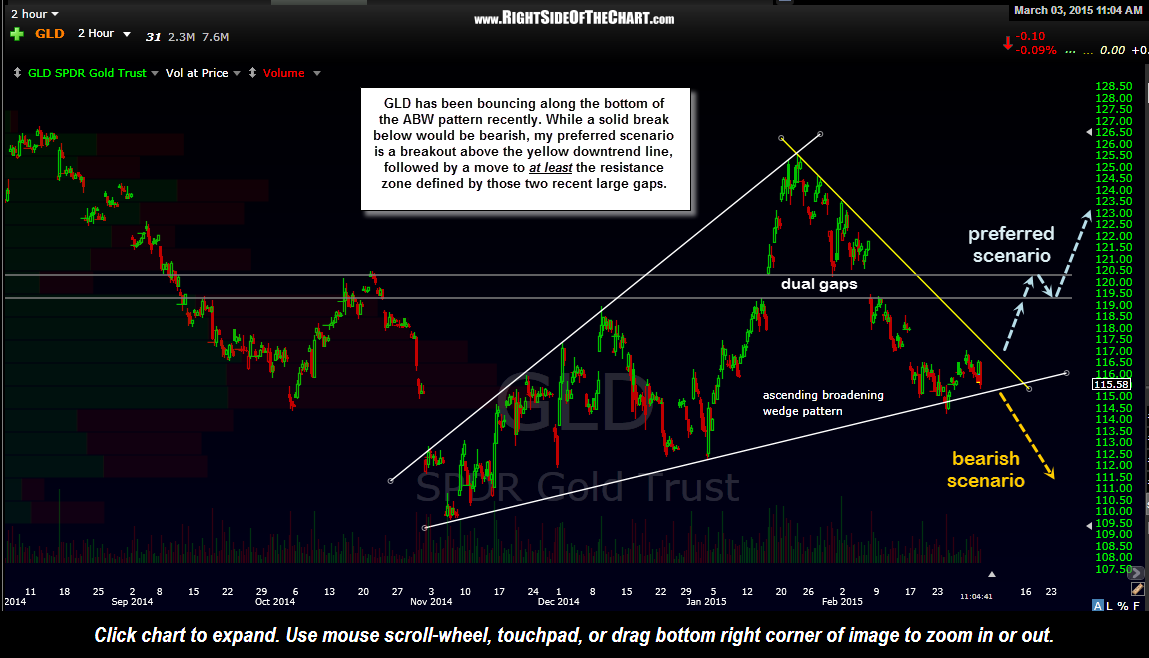
GLD 2 hour March 3rd
Taking a look at the GDX (gold miners ETF) daily chart, GDX still offers an objective long entry for both shorter-term swing traders & longer-term trend traders here just above dual support (horizontal & trendline). A long entry or add-on here with a stop below the 20.00 area offers a downside risk of about 50 cents with an upside potential of at least $7.00 as GDX has the potential to rise to the 27.65 level in the coming months. Even if the odds favor being stopped out, which I don’t believe that they do, a long entry here offers an exceptional R/R (risk-to-reward ratio) of 14:1.
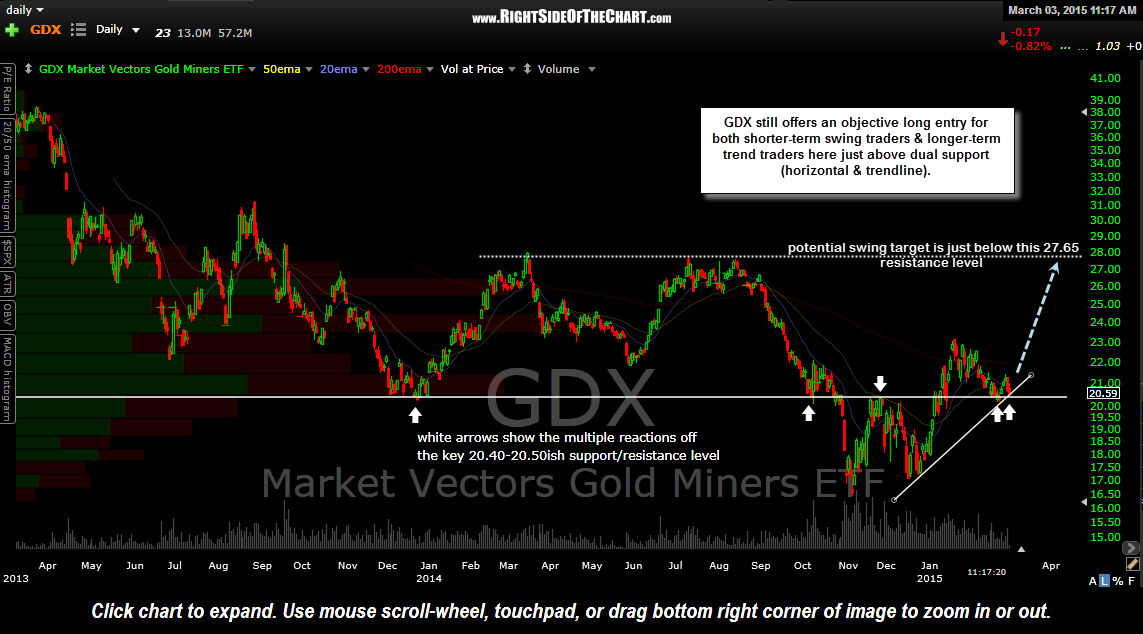
GDX daily March 3rd