
GDX (gold miners ETF) appears to have formed a bear flag continuation pattern following the recent breakdown, backtest & sharp move below the ascending price channel that was highlighted on the 30-minute time frame on Monday (first chart below). Also note that my 14/34 ema trend indicator (histogram below these charts) has now moved to bearish after successfully capturing the bulk of the last three bullish & bearish trends in GDX (GDX was in a sideways trading range before that, which is when you want to avoid using such trend indicators or even trade at all).
My expectation is for a continued move down to at least the 15.80 level & quite likely a continued move down to backfill the Feb 3/4 gap (as outlined in the scenario below). A break below the bear flag & especially today’s low of 16.15 would likely spark the next impulsive wave of selling in GDX.
-

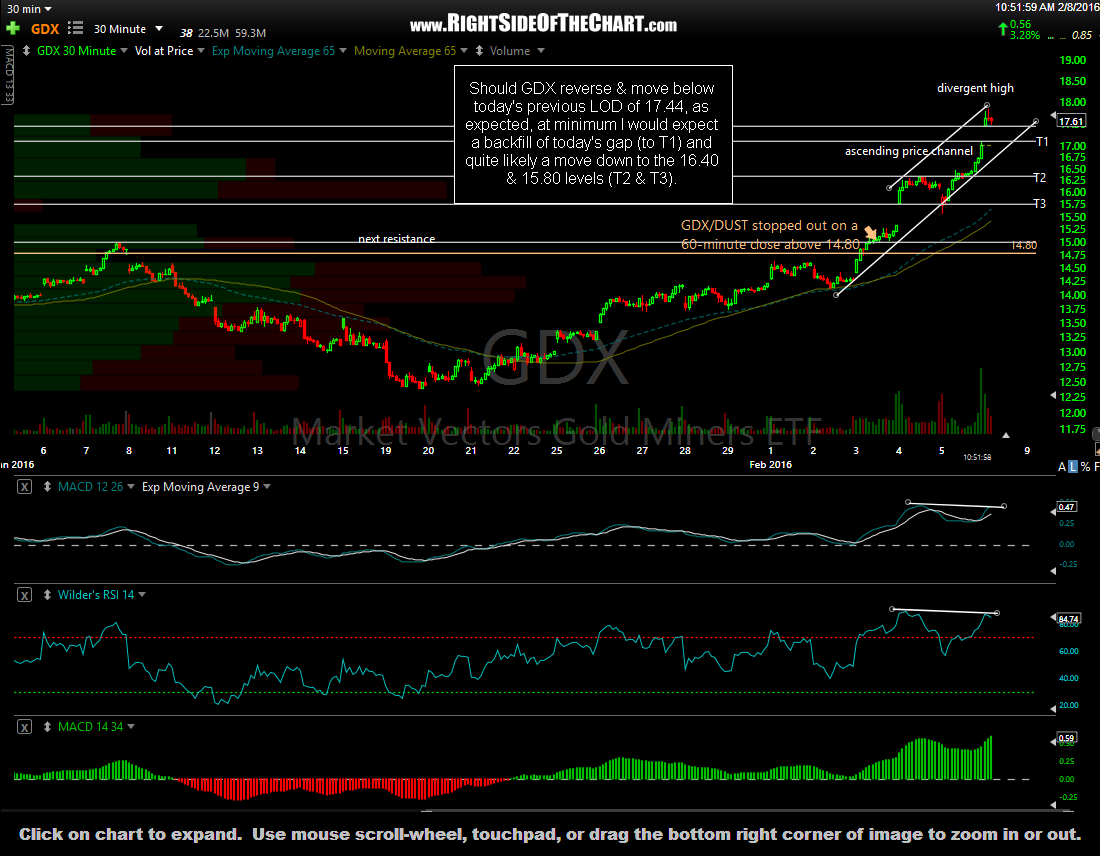
- GDX 30-minute Feb 8th
-
- GDX 30-minute Feb 10th
