
In the previous update on GDX (gold miners ETF, first chart below), it was stated that ” A break below the sub-channel would likely bring GDX to the bottom of the primary wedge/channel. Following a likely reaction there, a breakdown below the lower uptrend line would likely bring GDX to any or all of the horizontal support level shown on this chart.”
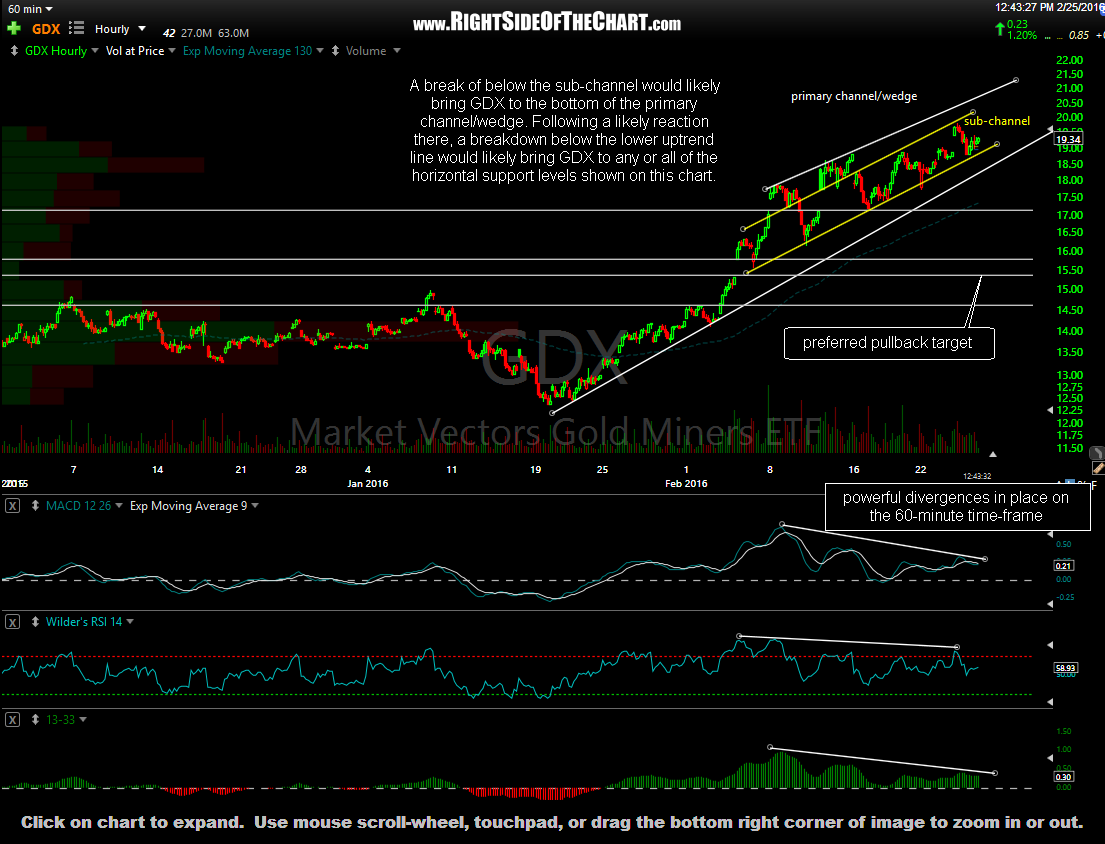
GDX 60-minute Feb 25th
Since that post from Thursday of last week, GDX kissed the bottom of the channel & produced a reaction, as expected, and is currently backtesting the sub-channel from below. As stated before, the negative divergences in place on nearly all price & momentum indicators & oscillators indicated that GDX will likely break down below the channel sooner than later. I’m sitting tight with the recent official short trade on NUGT for now and will only add if & when prices clearly break below that channel (a 60-minute close below). If so, the 17-17.20 area is the highest probability target at this time. Updated 30-minute chart of GDX below:
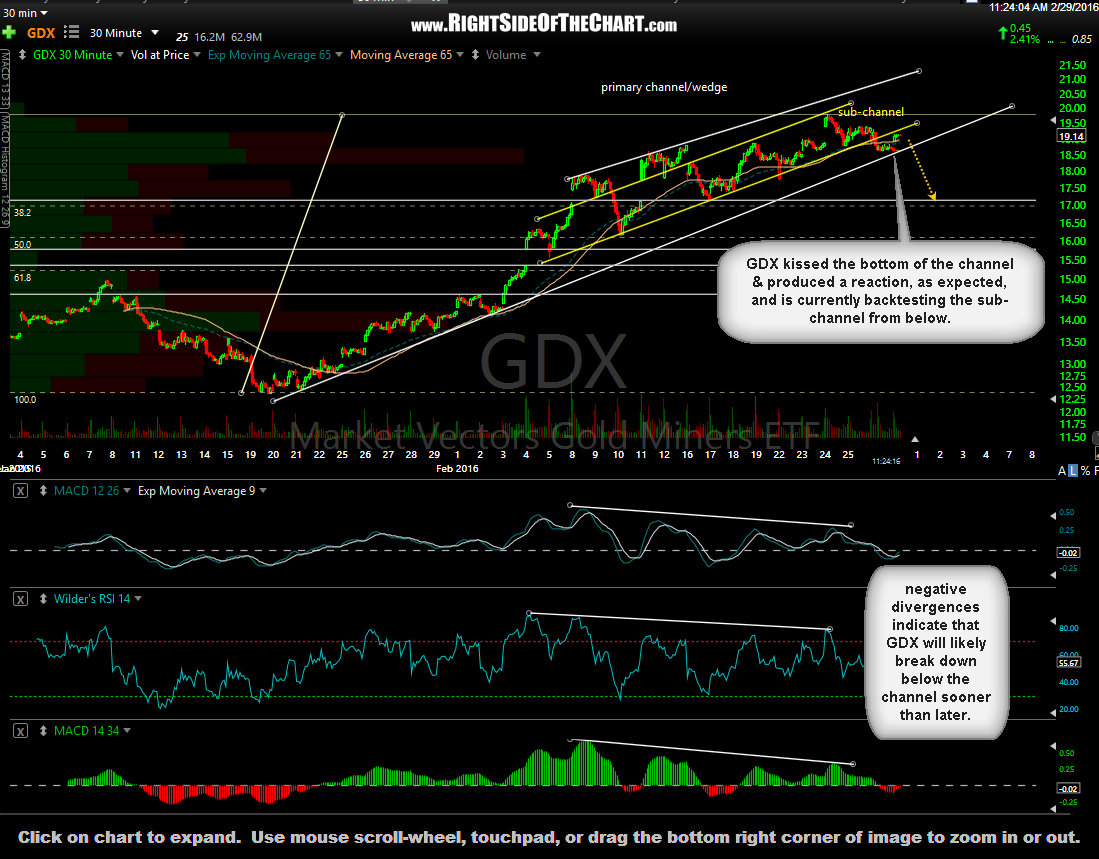
GDX 30-minute Feb 29th