
Yesterday I spent about a dozen hours, most of my waking day, analyzing charts ranging from frequencies of 1 minute all the way out to monthly charts spanning decades. I studies nearly all major US & international stock indices, global currencies, fixed income, commodities & precious metals and dozens, if not a hundred or more, individual stocks. After the market closed, I had started to work on a video covering the recent developments in the markets & where we are likely headed next. In doing so, it became apparent that there were so many relevant developments in the financial markets that it would be impossible to cover them all in one video (at least one that didn’t rival a full length movie in duration).
I’ve decided that it would be more efficient to do several smaller videos on specific categories or time frames. For example, to cover the US equity markets, I plan to do one video focused on the short-term outlook of the markets which would be more applicable to active traders while there’s more than enough important technical developments to do a separate video on the longer-term out for swing & trend traders as well as investors.
Lately, and I expect this trend to continue for the near-future, I have largely morphed largely from my typical swing trading style (i.e.- typical holding periods measured in days, weeks or several months) to an active day trader, going both long & short the same instruments every day this week (in addition to opening & closing some swing trade positions). One of the benefits of recent spike surge in volatility has been that technical analysis has worked incredibly well. For example, one of my preferred trading proxies this week has been the QQQ (via various leveraged derivatives such as futures, options, TQQQ & SQQQ, depending on the account in which the trades were placed).
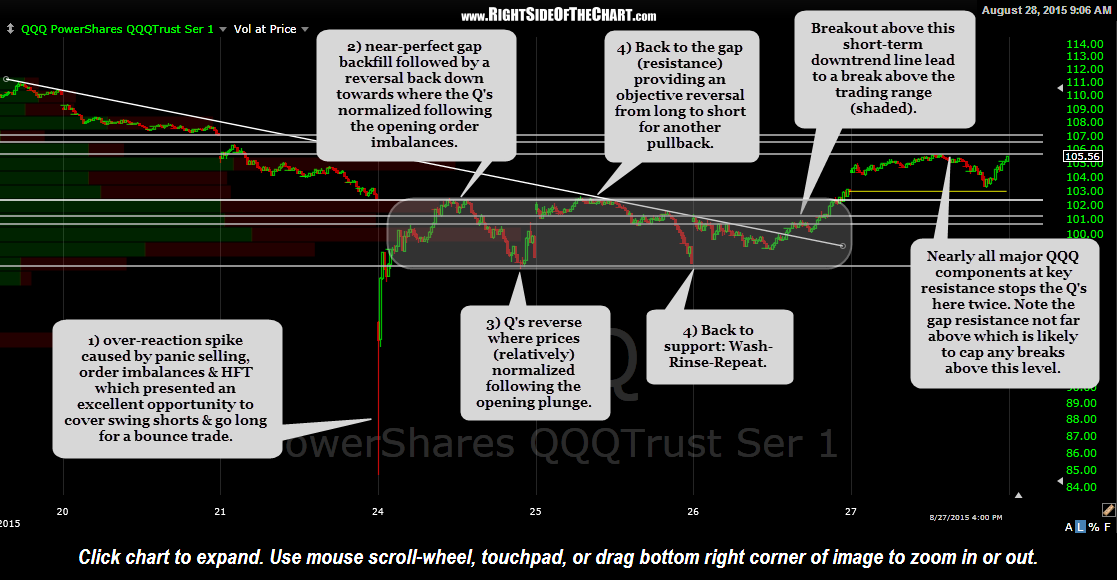
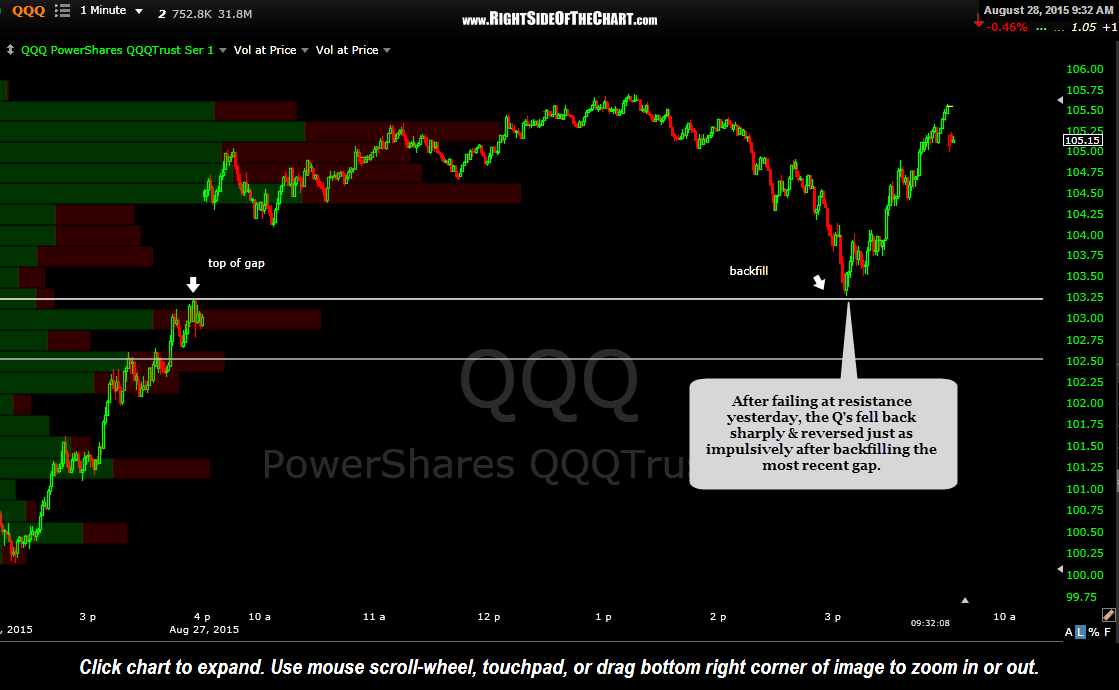
While I didn’t catch every one of the trading opportunities pointed out on this 5-minute chart, I was able to catch most of them & I mainly wanted to share these charts to point out just how well technical analysis works when volatility is high. The next two charts are the QQQ 1 minute chart that was posted on Monday, accurately forecasting where the Q’s would reverse, followed by the recent 1-minute chart illustrating just how conducive the market has been to trading this week, with technical analysis working about a well as one could expect.
-

- QQQ 5 minute Aug 28th
-
- QQQ 1 minute Aug 24th

-
- QQQ 1 minute Aug 27 gap backfill
While I believe that the longer-term outlook for the US equity market remains bearish (i.e.- stocks will ultimately move well below Monday’s lows), the near-term & even the intermediate-term outlook is somewhat obscure as I can make a nearly equally compelling bullish case as I can a bearish case. I will discuss those bullish & bearish developments in the videos which I plan to start rolling out today.
Bottom line: This market might continue these back & forth rips & dips for several more days, possibly weeks. If that is the case, very nimble, active traders will continue to have the opportunity to successfully trade primarily using the intraday charts, although personally I always trade with an eye on the daily charts, even if day trading (i.e.-opening a position that I plan to close out before the bell). Typical swing traders, trend traders & investors might opt to keep things light until the next major direction in the market becomes more clear. I still favor another major thrust down & with a mountain of overhead supply (resistance) just above, I have started to add back some of the short exposure that was closed out on Friday afternoon & Monday morning.
With that being said, I still believe there is a decent chance that this market could break to the downside and move sharply lower any day now. In the videos I will discuss the important support levels & other technical developments that I’m watching & what my game plan will be if it becomes apparent that the markets are headed lower. US equity markets recently broke down below their primary bull market uptrend lines with nearly all short-term & longer-term trend indicators recently moving from bullish to bearish, where they still remain despite the recent bounce in the markets. Should the markets continue to power up & slice through the overhead resistance as if it weren’t there, that would tell us a lot about the underlying supply/demand dynamics & indicate that the recent sell signals & plunge in stock prices was merely a long-over due correction in an ongoing bull market with more room to run.
Yesterday I was asked my favorite sectors on the short side & at this time. I would have to say that the most promising swing-short candidates are the biotechs, technology & financials (in descending order). I had also pointed out a major breakout in the EUR/USD currency pair recently which is likely to have longer-term bearish implications for the US Dollar. Although I haven’t have time to post it yet, the US Dollar Index ($USD or $DXY) also recently broke down below a key uptrend line and is currently close to backtesting. Should the dollar move lower in the coming months as I would expect, that would mostly likely be bullish for commodities & precious metals. There’s a ton of liquidity sloshing around from the money printing parties that the global central banks have been hosting for the last several years. If we do get a bear market is equities soon, that money will find a home somewhere and with bond prices having nowhere to go but down from here, at some point we could begin to see a surge in commodities which are likely in the latter stages of one of the most vicious bear markets they have experienced.