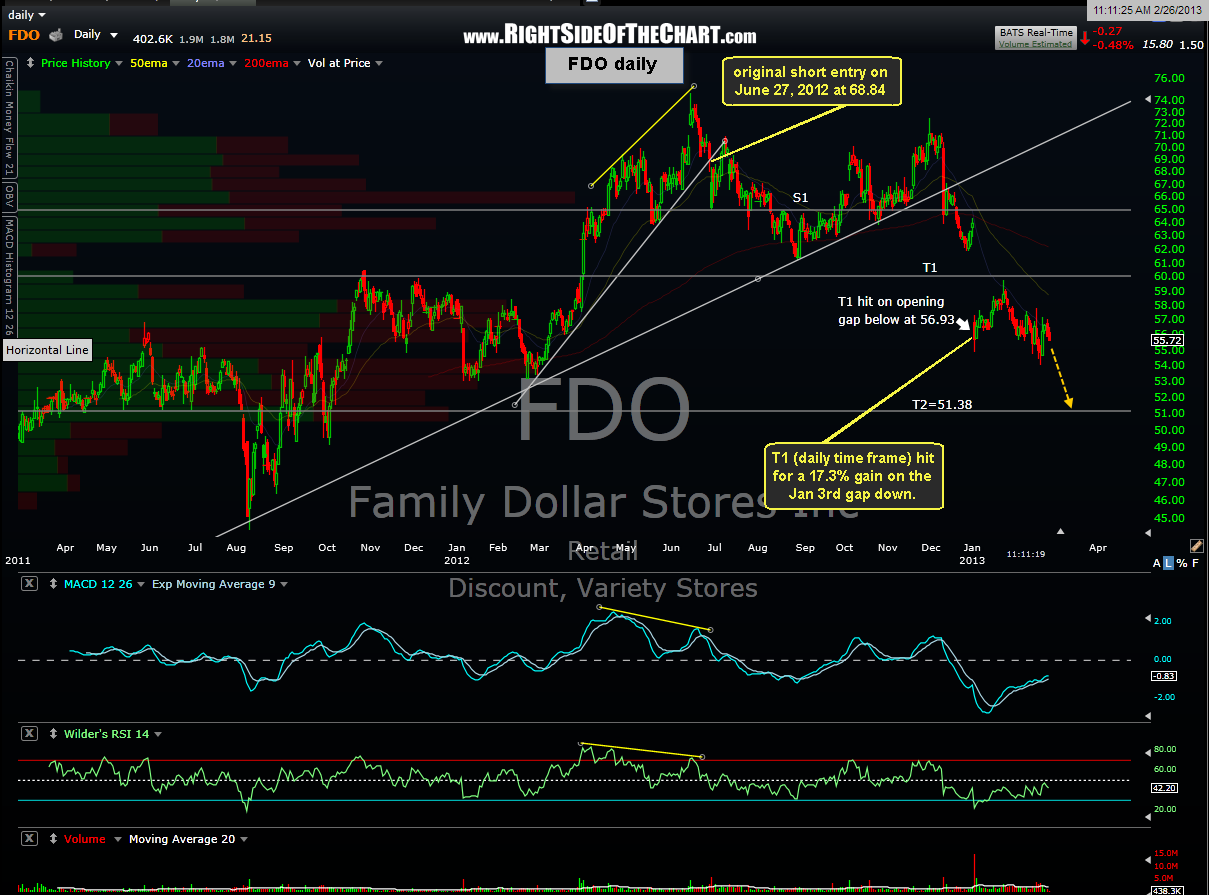
FDO is a good example of how, contrary to popular belief, one can successfully swing or trend trade the short side just as effectively as the long side, given the right setup and analysis of the charts. FDO was originally posted as an active short back on June 27th, 2012 at 68.84 and has remained an active short trade since. The first price target was hit on Jan 3rd for a 17.3% gain when FDO made a large gap down well past the posted T1 level. As far as tracking, just like real world results, if a price target is exceeded on an opening gap (i.e.- a gap above the price target on a long or a gap below a price target on a short) then it is the opening price on the day of the gap that will be counted as that price target. Ditto for losses on trades stopped out on gaps beyond the stop levels. Reason being is that limit orders get passed by on gaps and so therefore, one should immediately book profits once the price objective they are targeting is exceeded (to not do so would be the epitome of greed and undisciplined trading/investing).
Another example highlighted by this trade is the fact that different targets are often listed on different time frames. For example, this trade has different targets on both the daily chart as well as the weekly chart. This is because every trader or investor has a unique trading style and typical time frame. The trade ideas on Right Side of the Chart are primary intended to be swing trades or investments typically lasting from several weeks to several months. However, trading styles amongst traders vary widely. Some traders prefer taking quick, relatively small profits and moving onto the next trade while other prefer a less active longer-term, hybrid trading/investing style. Of course, due to the explosive nature of many of the chart patterns, such as wedge patterns which act like coiled springs, building energy as the stock trades in an every tightening range until a catalyst (i.e.-breakout) brings in a sudden wave of buyers, it is not uncommon to see many trades posted here hit one or more profit target within a day or two of breaking out.
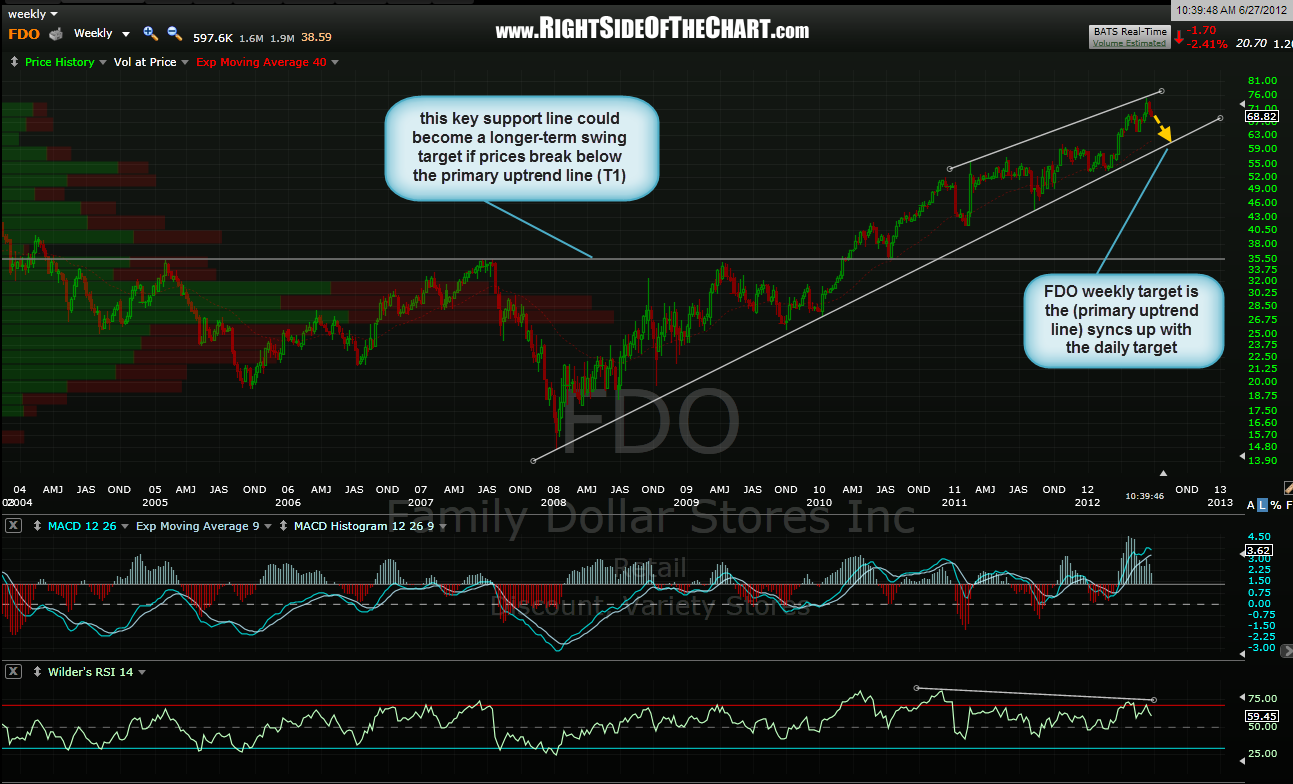
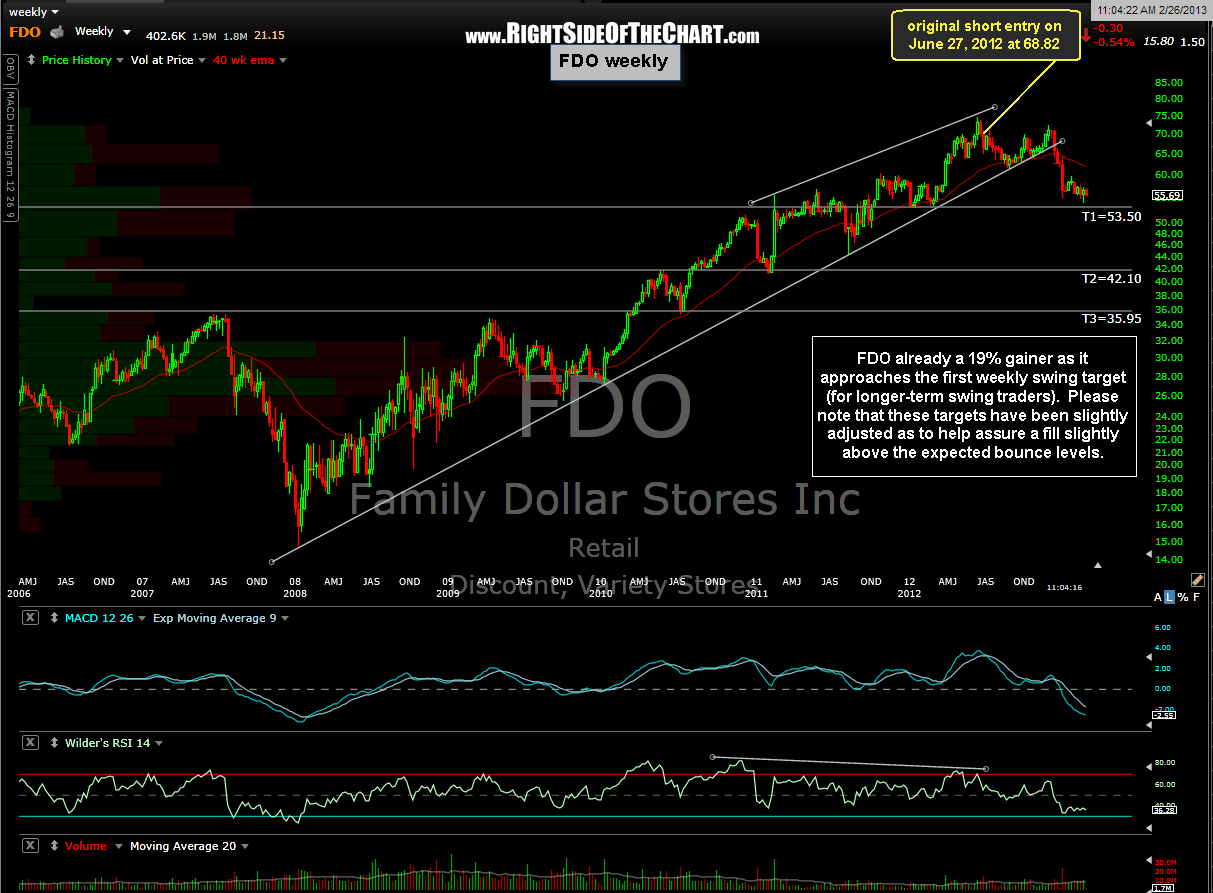
Here are the original daily and weekly charts on the FDO trade followed by their respective updated charts. My preference on this trade is to trade off the weekly charts (using those targets, which have been slightly adjusted), allowing fairly liberal stops commensurate with such a time frame and relatively large profit targets. At this time, my preferred target is split evenly between the 2nd & 3rd (final) targets on the weekly chart.