
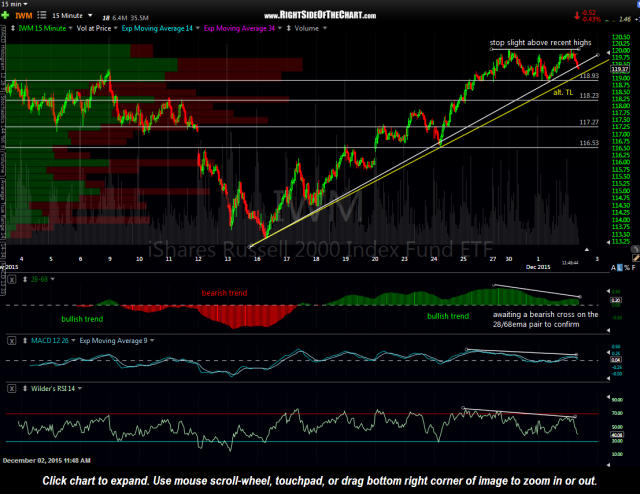
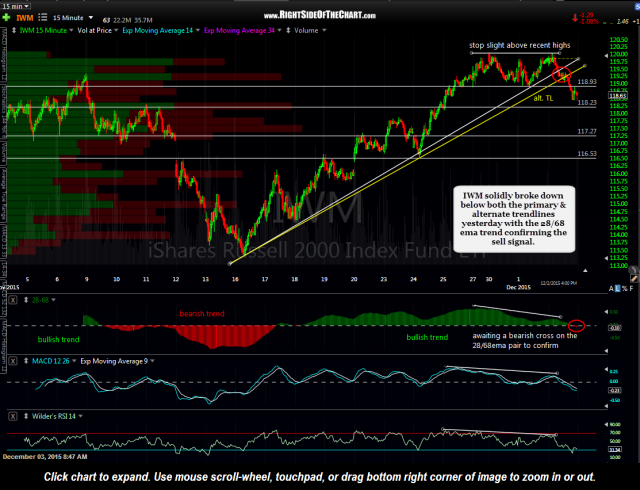
The first 15-minute chart of IWM was posted in the Trading Room yesterday shortly before noon with the following comments: Aggressive short entry (unofficial) here on the breakdown below the primary uptrend line on the 15-min chart of IWM (TZA long or TNA short). Additional confirmation will come on a break below the alternative uptrend line & a bearish cross of the 28/68ema pair (15–minute frame). Horizontal lines mark potential price targets (unadjusted for optimal fill, set BTC orders slightly above). The second chart is IWM as of yesterday’s close, showing prices clearly closing below both trendlines as well as a confirm sell signal on the 28/68-ema pair (histogram).
-

- IWM 15 minute Dec 2nd
-

- IWM 15 min Dec 2nd close
At this point, I’m waiting (and expecting) a break below this minor uptrend line as well as a bearish crossover on the 28/68-ema pair on this QQQ 15-minute chart for additional confirmation that a new downtrend in the US markets is most likely underway. One final note worth mentioning is that AAPL is once again trading below the key 40-week EMA, which has done a superb job of defining primary bull & bear markets. The last few weeks have seen AAPL closing above & below this level after printing the first weekly close below back on August 7th, signaling the start of a new bear market that may or may not be over yet. More on AAPL later.

QQQ 15 minute Dec 3rd