
It is clear that the recently on & off inverse correlation between the US Dollar and gold prices has once again returned, with a near perfect inverse correlation lately as the dollar & gold react to any economic releases that could impact the next FOMC rate decision. Therefore, if you want to know where gold prices are headed, then all you have to do is figure out where the US Dollar is headed. This 5-minute period chart plots GLD (gold ETP) against UUP (US Dollar ETP).
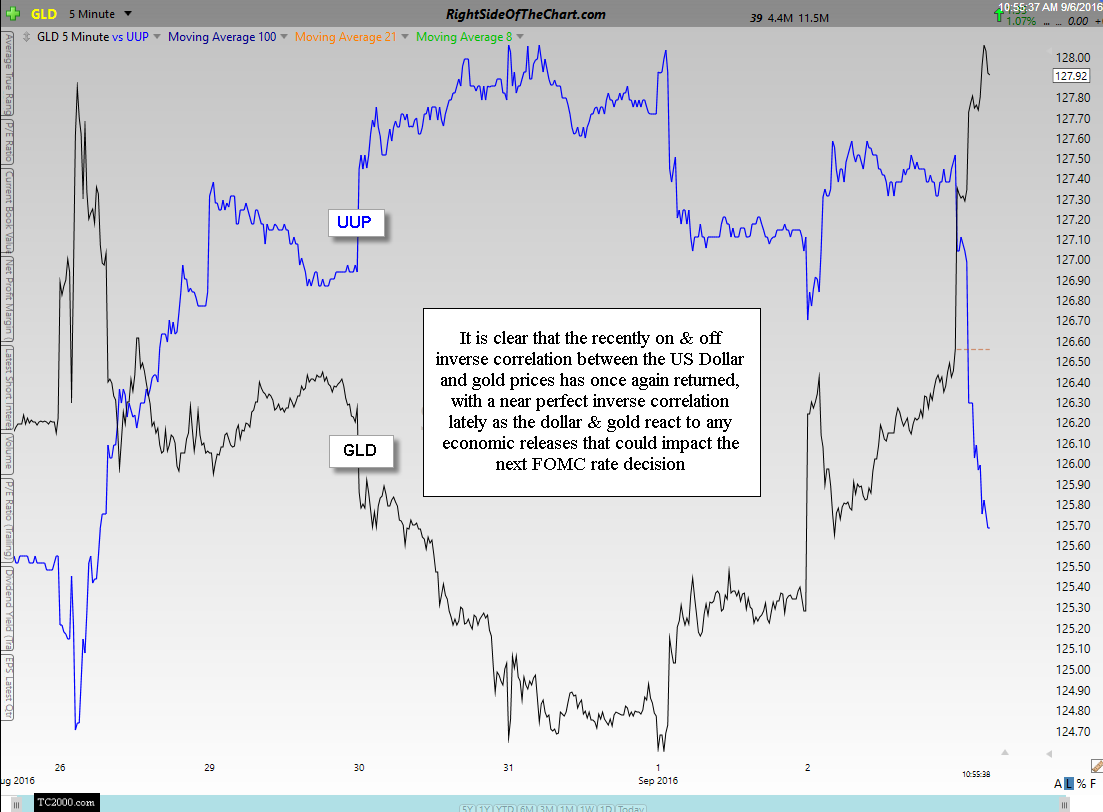
GLD vs UUP Sept 6th
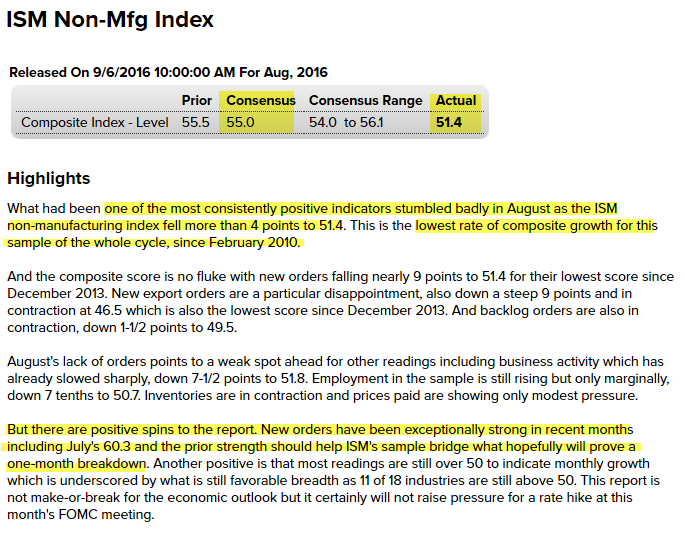
Figuring out where the Greenback is heading is easier said than done, of course, especially lately as the market & currency traders hang on every single word uttered by any Fed official and the dollar’s reaction to the most recent economic reports, such as the Employment Situation release on Friday & today’s ISM Non-Manufacturing Index release, both of which came in below expectations, triggered an immediate & very sharp drop in the dollar as the odds for a rate cut at next FOMC meeting, or at least the perception of those odds via market participants, were immediately reduced.
-

- ISM Non-Mfg Index Sept 6th
-

- ISM Non-Mfg Index charts Sept 6th

-

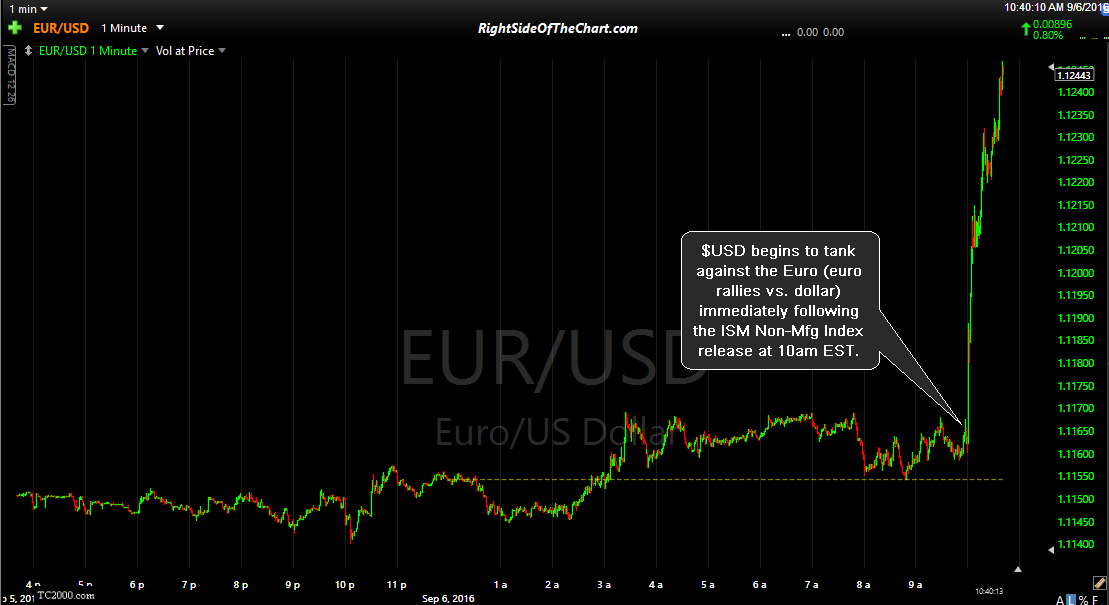
- EUR-USD 1-minute Sept 6th
-

- USD-JPY 1-minute Sept 6th

While it might be next to impossible to predict the very near-term price direction in the US Dollar, as that has most recent been driven by economic releases that can go either way, I do believe that the intermediate-term (weeks to months) outlook for the dollar can be ascertained from the charts with a fairly high degree of confidence. Although the US Dollar may (or may not) need one more thrust back down against the Japanese Yen within this bullish falling wedge pattern, it appears very likely to me that an lasting trend reversal & rally in the USD/JPY will occur soon.
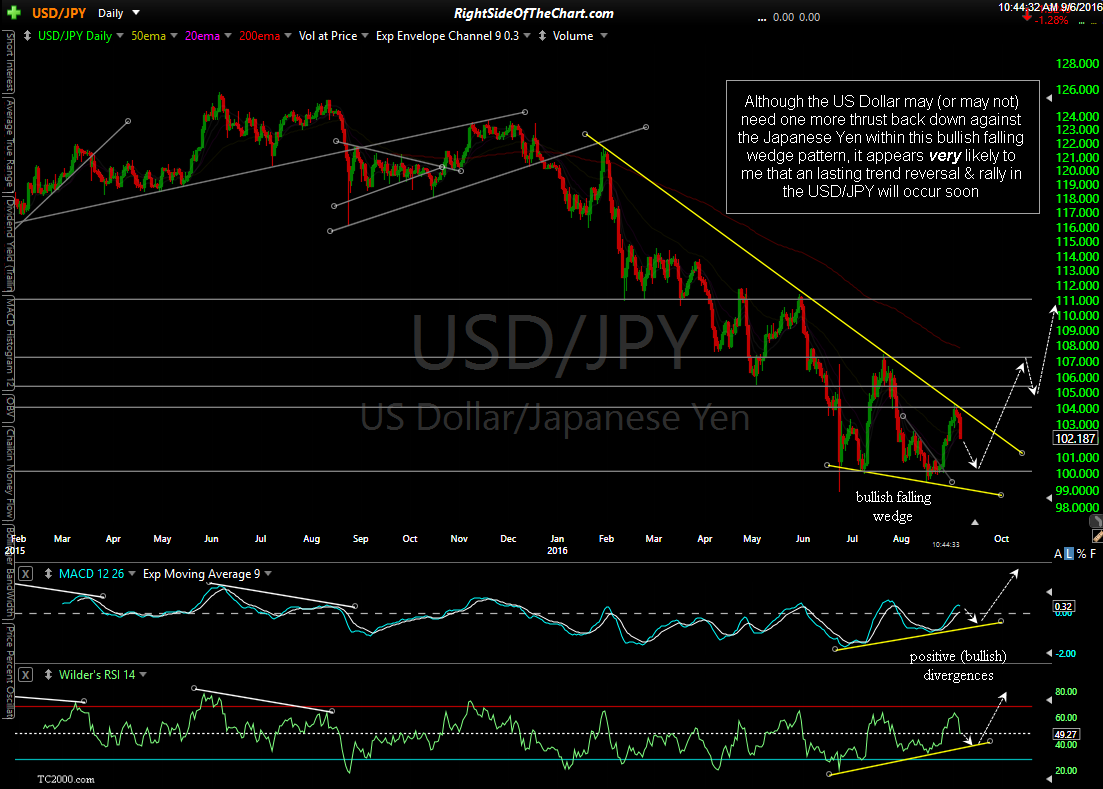
USD-JPY daily Sept 6th
While this sloppy, non-symmetrical triangle pattern could break either way, based on the clearly bearish intermediate-term posture of the $USD vs. the Yen, I favor a downside break & move lower in the coming months (i.e. Euro down/Dollar up). Should both scenarios occur (US Dollar rallies against the Yen & Euro), that would likely provide head-winds for gold as a stronger dollar buys fewer ounces of gold (putting supply/demand dynamics & other variables aside), thereby putting downward pressure on gold prices.
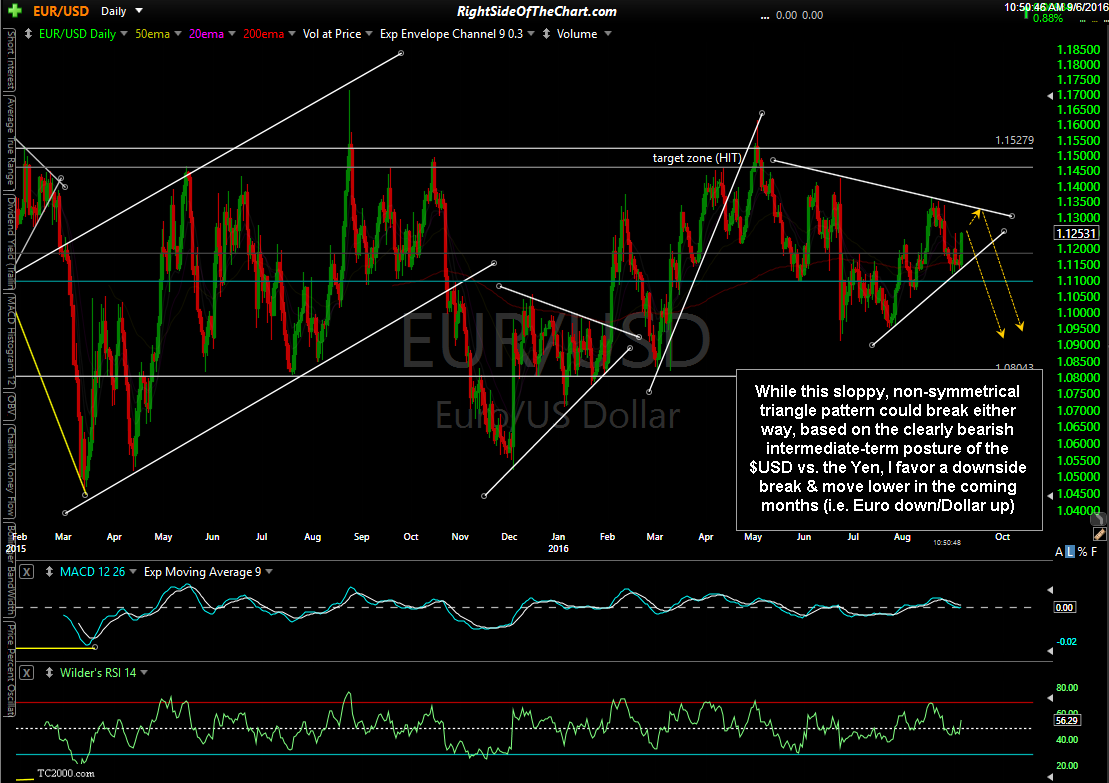
EUR-USD daily Sept 6th