
One of the questions that I get from time to time is the methodology that I employ in determining my price targets. Although a more detailed explanation can be found in the new Q & A section (located on the main menu bar), here’s a real-time example of a price target calculation for CVX.
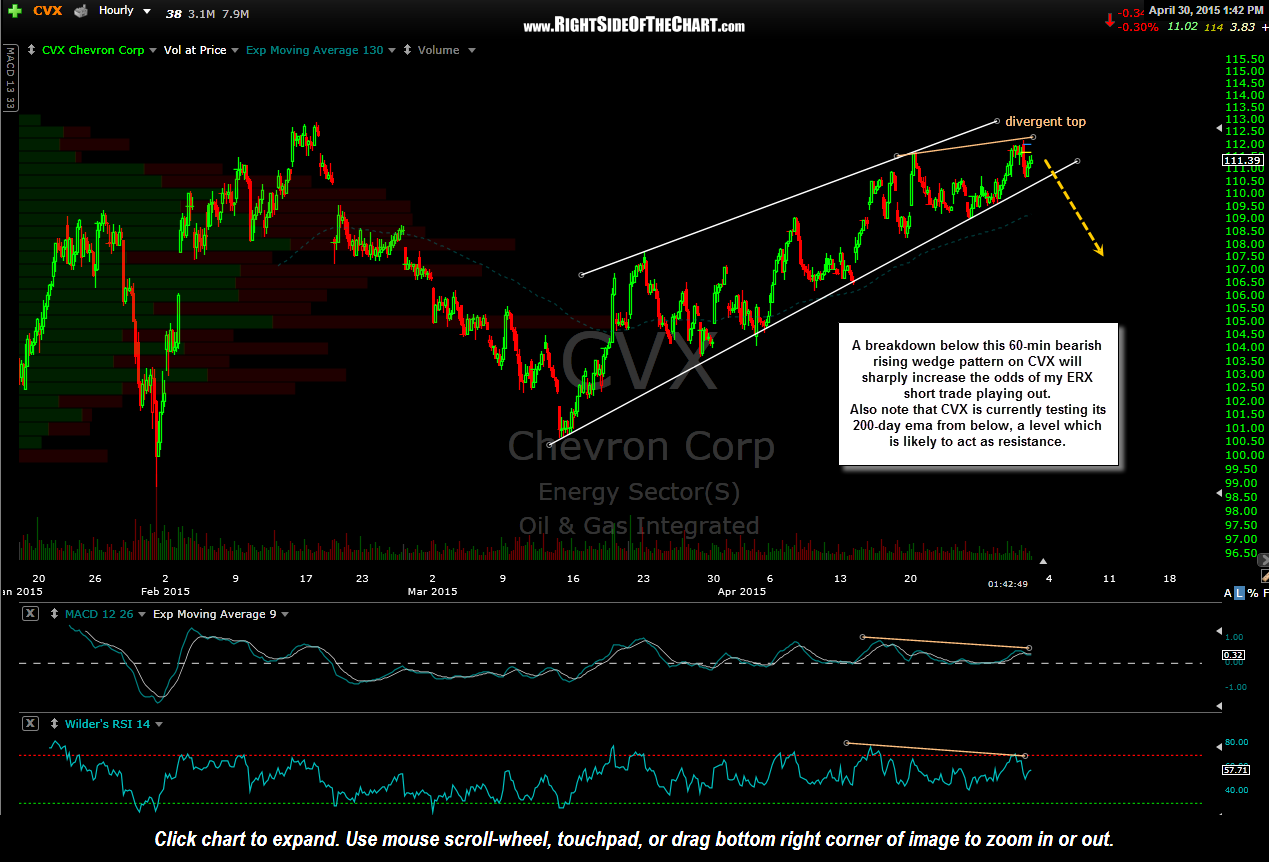
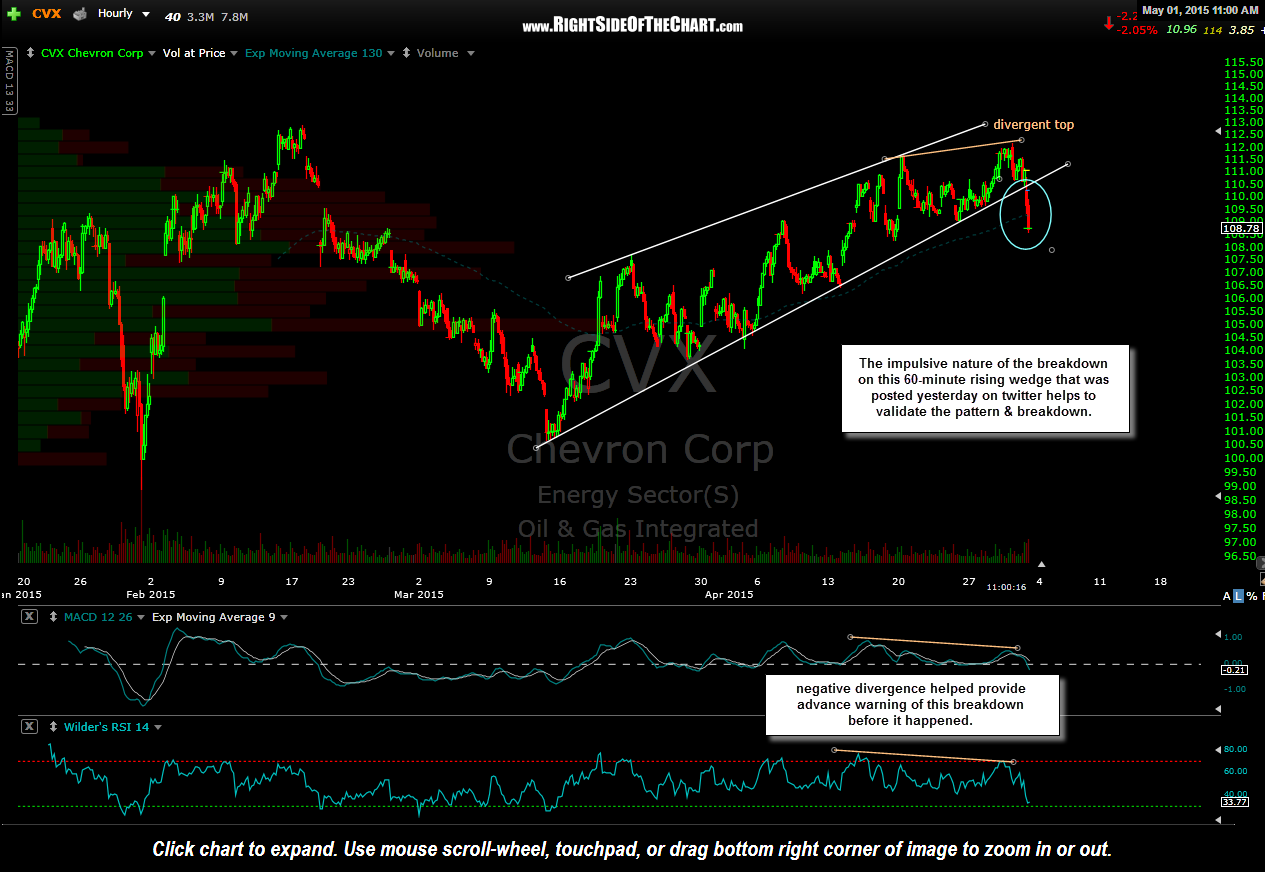
Shortly after the ERX/XLE short entry last week, I posted these two 60-minute charts of CVX, which is the second largest component of the energy sector right behind XOM. The first chart below, posted on Thursday, showed what appeared (and proved to be) an imminent breakdown below a bearish rising wedge pattern, complete with negative divergences in place to help validate the bearish nature of the wedge pattern. The second chart, posted on Friday, showed that prices went on to not only break down below the wedge pattern but did so in an impulsive manner (a series of large, red candlesticks on above average volume). Breakouts accompanied by above average volume and impulsive buying or selling have a much higher chance of playing out vs. those on average or below average volume and relatively muted price action.
-

- CVX 60 minute April 30th
-

- CVX 60 minute May 1st
Now let’s fast forward and take a look at the updated 60-minute chart of CVX. Since that impulsive breakdown, which was posted on Friday morning, CVX consolidated in what appears to be a text-book looking bear flag pattern. Bear flags are continuation patterns that form after an impulsive move lower and usually resemble the form an upward-sloping flag. The impulsive move lower leading up to the formation of the flag is referred to as the “flagpole”. The trigger, or next sell signal for any bear flag pattern occurs if/when prices breakdown below the pattern, which occurred early today in CVX.
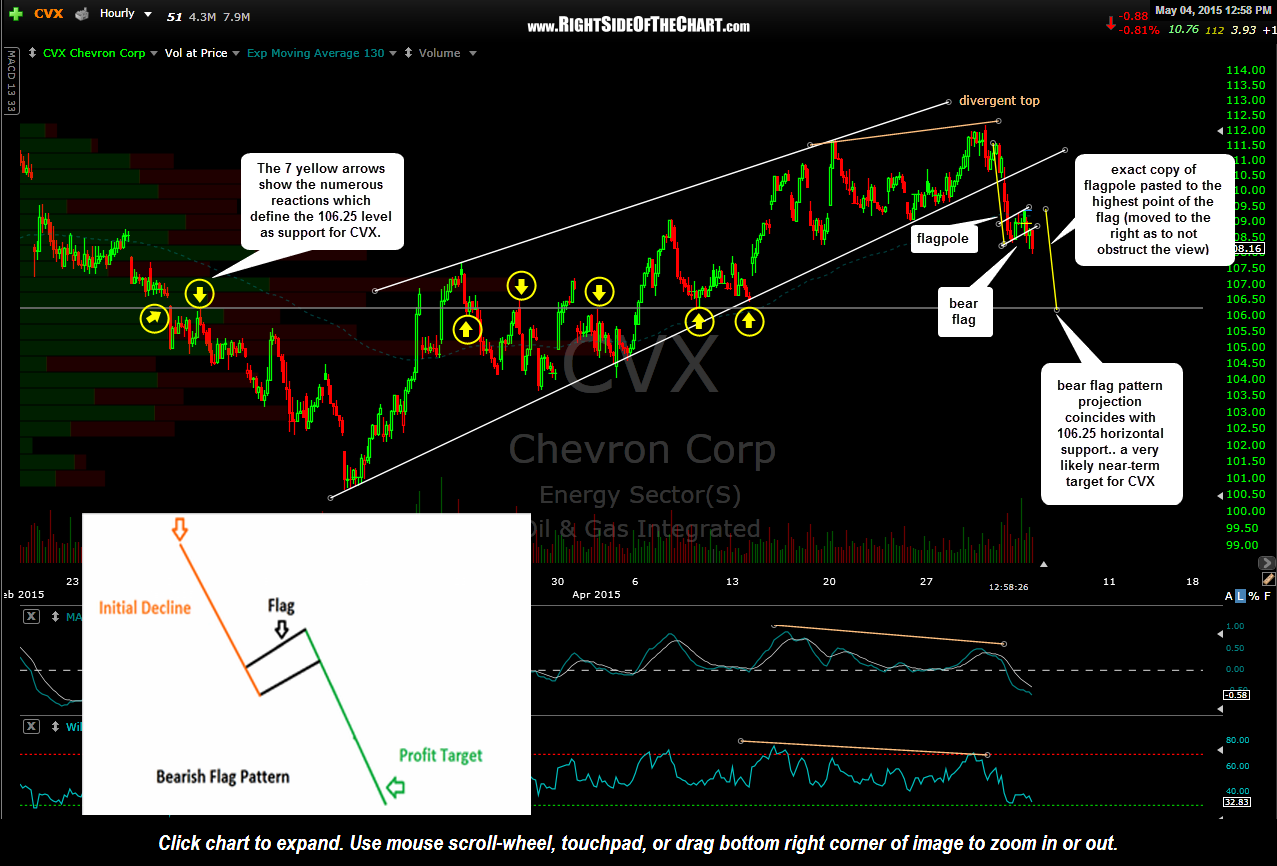
CVX 60 minute May 4th
Most textbooks will tell you that in order to calculate the projected measurement for the pattern (i.e.- where prices are ultimately headed) you would subtract the length of the flagpole, as measured from the top of where the impulsive move lower began to the lowest point within the flag, then add that distance to the upper-most point of the flag (which you can really only do once prices have broken below the flag as you won’t know where the top is until then). While I used to pull out my calculator & a scratch-pad in my rookie days of trading to calculate these targets, I long ago figured out that it is far easier to simply draw a trendline over the flagpole, then copy & paste that trendline starting at the top of the flag.
I also learned early on that the measured targets for bull & bear flags, as with all technical patterns, are just rough guides to give you an idea of approximately how far prices might go before the pattern has played out and a substantial reversal occurs. Something that I do when determining price target is to take the projected measured move of a chart pattern & then look to see if there are any decent support or resistance areas nearby that projected target and if so, I will likely adjust my target to more or less than the pattern projection, should a decent support or resistance level fall just above or below that level. Other considerations go into the adjustment or fine-tuning of price targets as well such as Fibonacci levels, the current trends (short, intermediate & long-term; bullish or bearish), and more.
On the updated 60-minute chart above, it just so happens that the projected measurement for the recent bear-flag breakdown in CVX projects right to a decent support level that comes in around 106.25. Taking it one step further, although I left the Fibonacci retracement levels off this chart as to avoid cluttering it up, it just so happens, coincidentally or not (more so not, IMO), the 50% Fibonacci retracement of the move from the March 13th lows up to the April 30th highs comes in slightly above that 106.25ish horizontal resistance. There is a substantial subset of traders who trade exclusively using Fibonacci levels and clusters and an even larger subset, myself included, that will incorporate Fibonacci levels into their trading as just one of many tools.
Bottom line: CVX may or may not continue lower and it may or may not reach the 106.25ish level but from technical perspective (i.e.- charting), I don’t think a much more solid case could be made that it will other than the fact that my recent ERX/XLE short trade is 100% a counter-trend trade, with an attempt to call a tradeable top in the energy sector during an extremely powerful run (of which we were able to catch the bulk of buy going long several energy stocks within days of their multi-year lows a couple of months ago using the similar methods for this most recent counter-trade short).