
USO (crude oil ETP) is now trading at the top of the bullish falling wedge pattern on the daily time frame with bullish divergences confirming that an upside breakout is likely to occur in the near-future.

USO daily Feb 25th
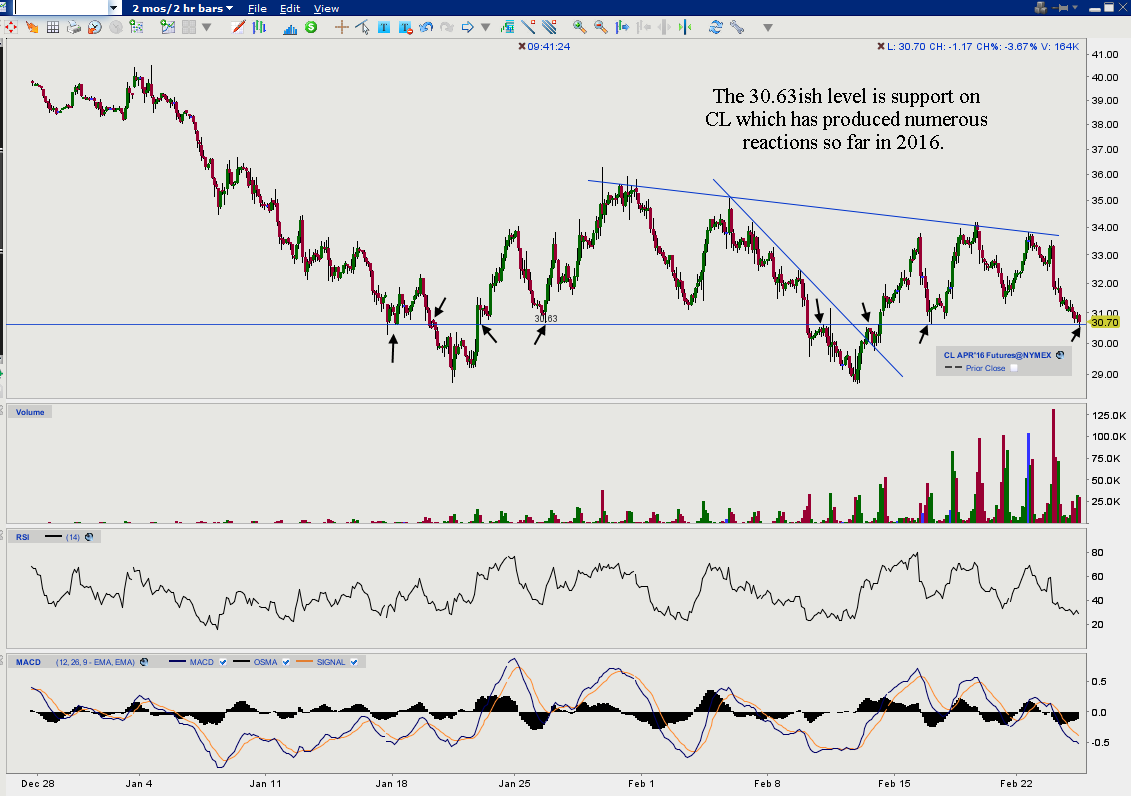
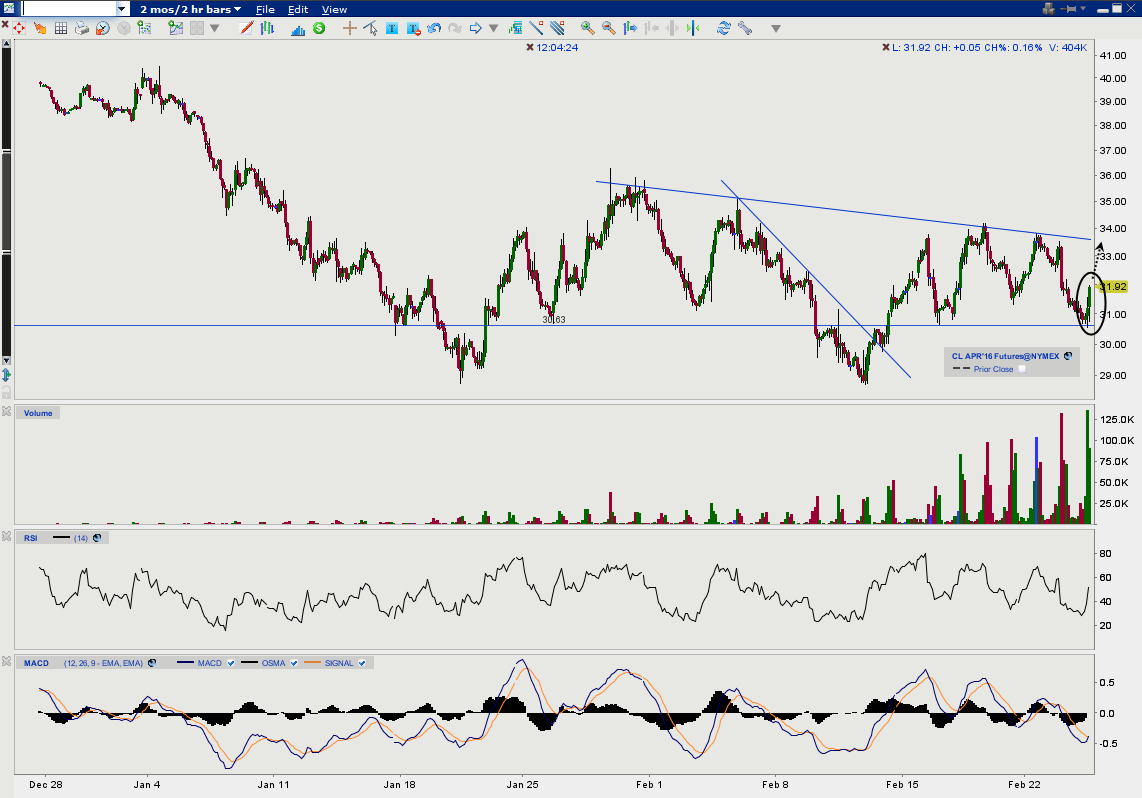
The string of 120-minute charts below show CL (crude oil futures), starting with the first chart that was posted in the trading room shortly after the equity markets opened yesterday, highlighting a move down to key support which offered an objective long entry. The next chart, posted later in the day, highlighted the impulsive move off that support level, stating that a continued move higher up to at least the blue downtrend line was likely. That downtrend line on CL coincided with the downtrend line that defined the top of the bullish falling wedge pattern on the USO daily chart posted above.
-

- CL 120 minute Feb 24th
-
- CL 120 min 2 Feb 24th
-
- CL 120-minute Feb 25th

As the initial tag of resistance from below often produces a reaction, I favor at least a minor pullback (with a ‘minor’ pullback already occurring as I rush to get this out). Hard to say how much more, if any, the pullback will be but I will say that the next solid break, especially with a 120-minute to daily close above those trendlines, will likely be the catalyst for a move up to any of the first three horizontal resistance levels shown on the USO chart above. The recent string of CL 120-minute charts are shown below above with the updated chart.