
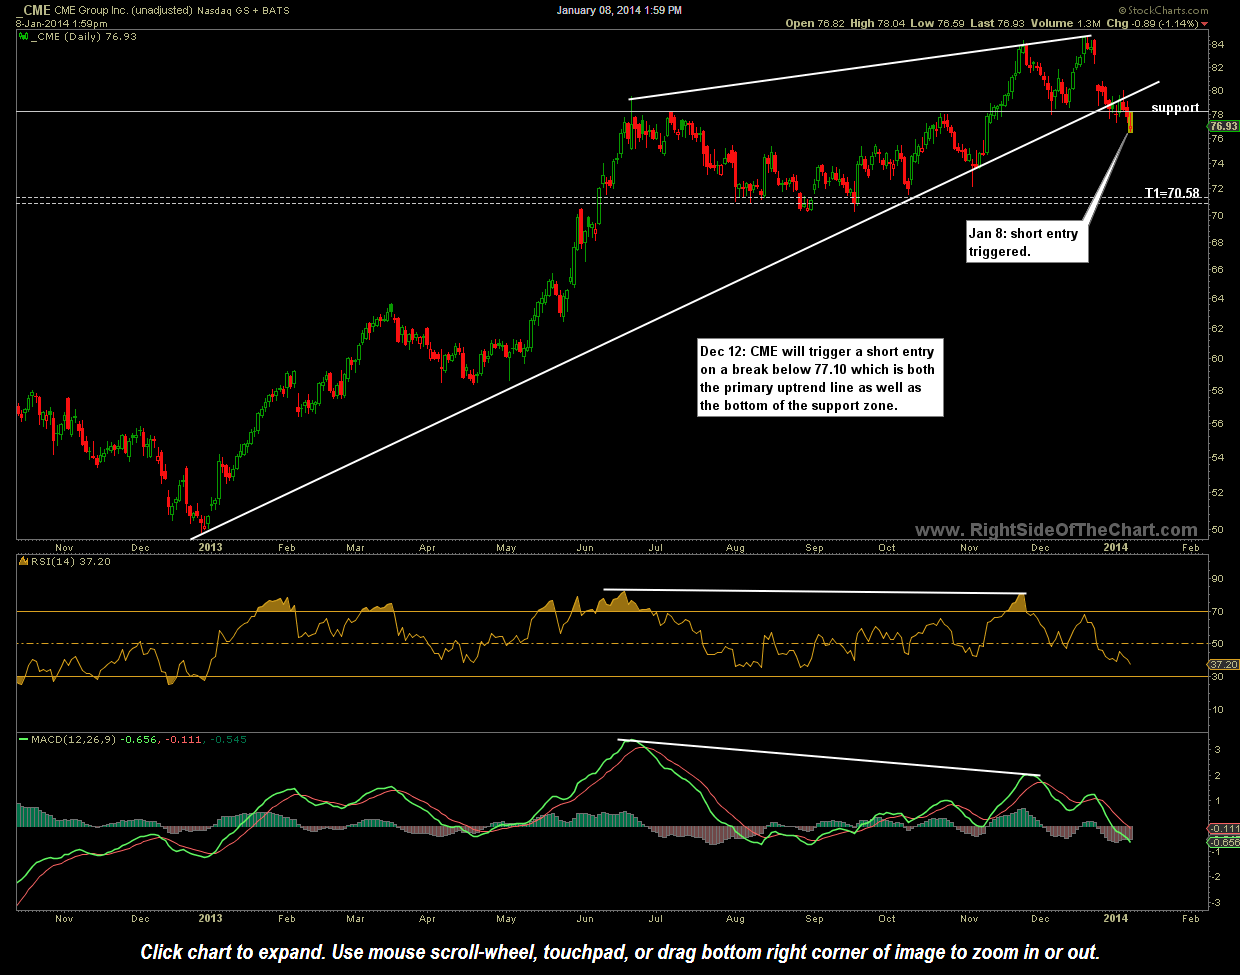
CME daily Jan 8th
The CME (CME Group) short setup has triggered an entry on today’s move below 77.10. If you had bookmarked the link posted with the original trade setup on Dec 12th, please use this new link to reference the live chart. The previous chart was saved using StockCharts.com’s default of showing the dividend and split adjust prices which distorts the true price action on the chart of dividend paying stocks. The previous price target remains the same although I have added the suggested buy-to-cover level to this updated, unadjusted daily chart.
For those following the trade ideas on RSOTC.com, remember to set your own trendline or static price alerts. Although every effort is made to update the trade ideas when an entry, objective add-on, or price target is hit, with the large volume of trade ideas posted on RSOTC, real-time updates are not always possible.