
While the divergences in the broad market & the handful mega-cap tech stocks that have been holding it up have not yet succumbed to the negative divergences that have been building on their respective charts, the negative divergences that were highlighted on the Canadian banking sector & leading Canadian bank stocks most certainly have. In response to a request from member @lee1 for my analysis of the 3 leading Canadian banks: TD (Toronto Dominion Bank), BNS (Bank Of Nova Scotia) and BMO (Bank Of Montreal), I posted my outlook for those 3 banks along with the Canadian banking sector in this post back on March 8th. Updates on each, including the previous charts are posted below.
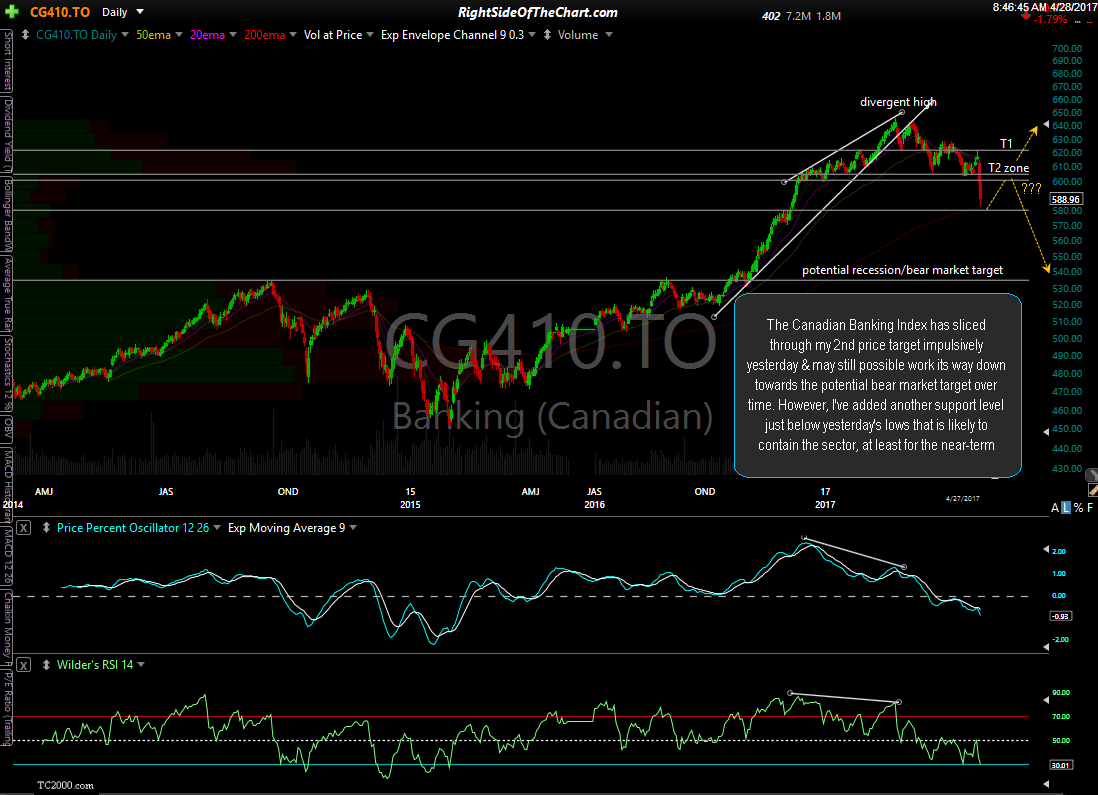
The Canadian Banking Index has sliced through my 2nd price target impulsively yesterday, falling 9% since the March 8th call for a correction right as the sector peaked. The Canadian banking sector may still possible work its way down towards the potential bear market target over time. However, I’ve added another support level just below yesterday’s lows that is likely to contain the sector, at least for the near-term.
-

- Canadian Bank Sector March 8th

-

- Canadian Bank Sector April 27th close
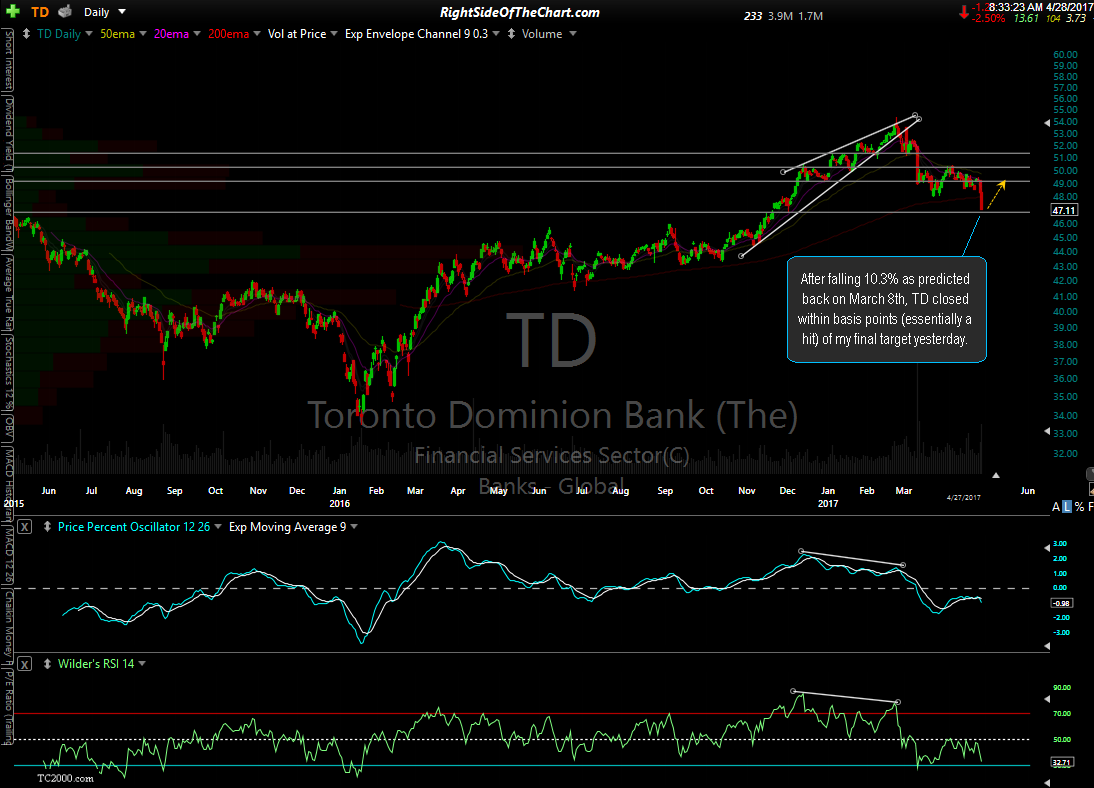
After falling 10.3% as predicted back on March 8th, TD closed within basis points (essentially a hit) of my final target yesterday. At this point, the odds of a reversal & at least a tradable rally are considerable & will only increase with each tick lower, should the stock fail to bounce off this support level or at least consolidate here as I would suspect. Should this level happen to give way, the next support comes in around 45.70-46.00.
-
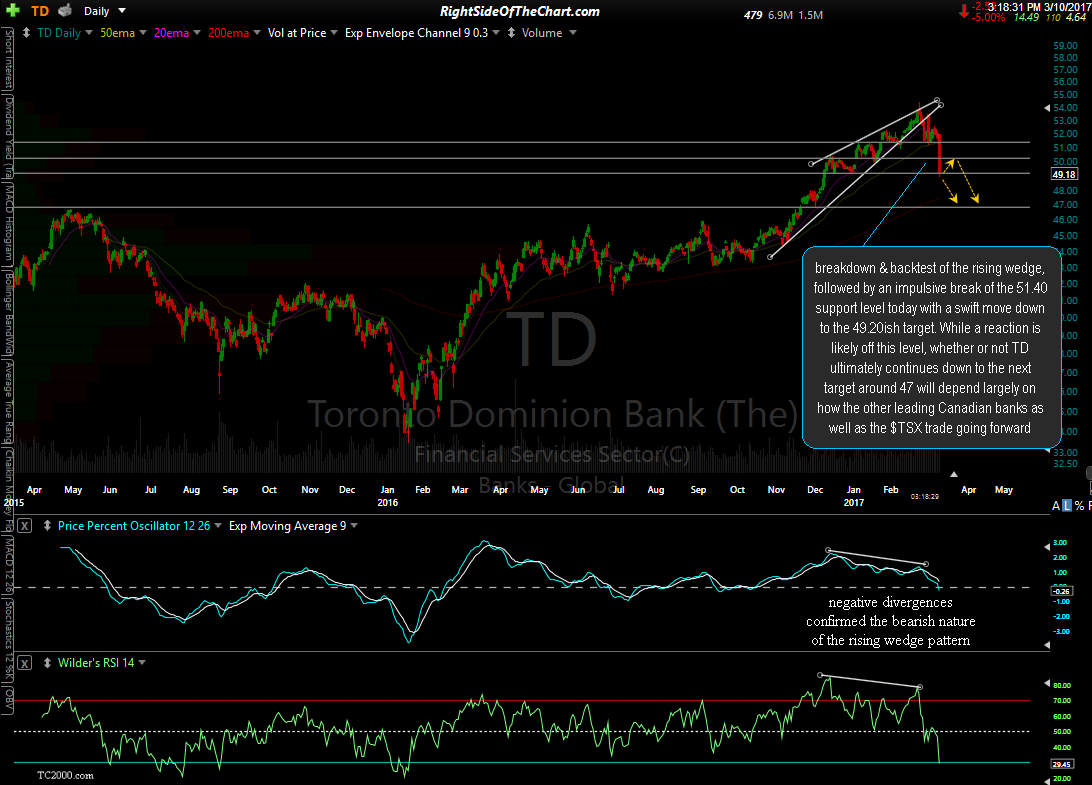
- TD daily March 8th

-

- TD daily March 10th
-

- TD daily April 27th close
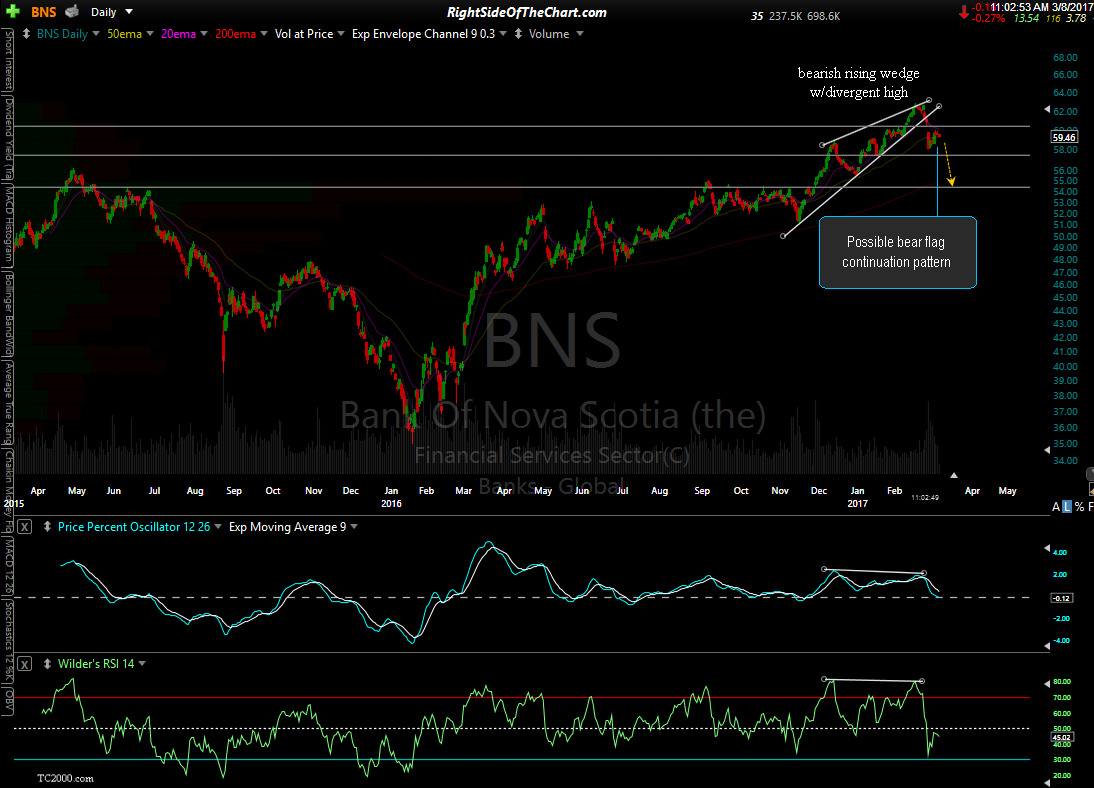
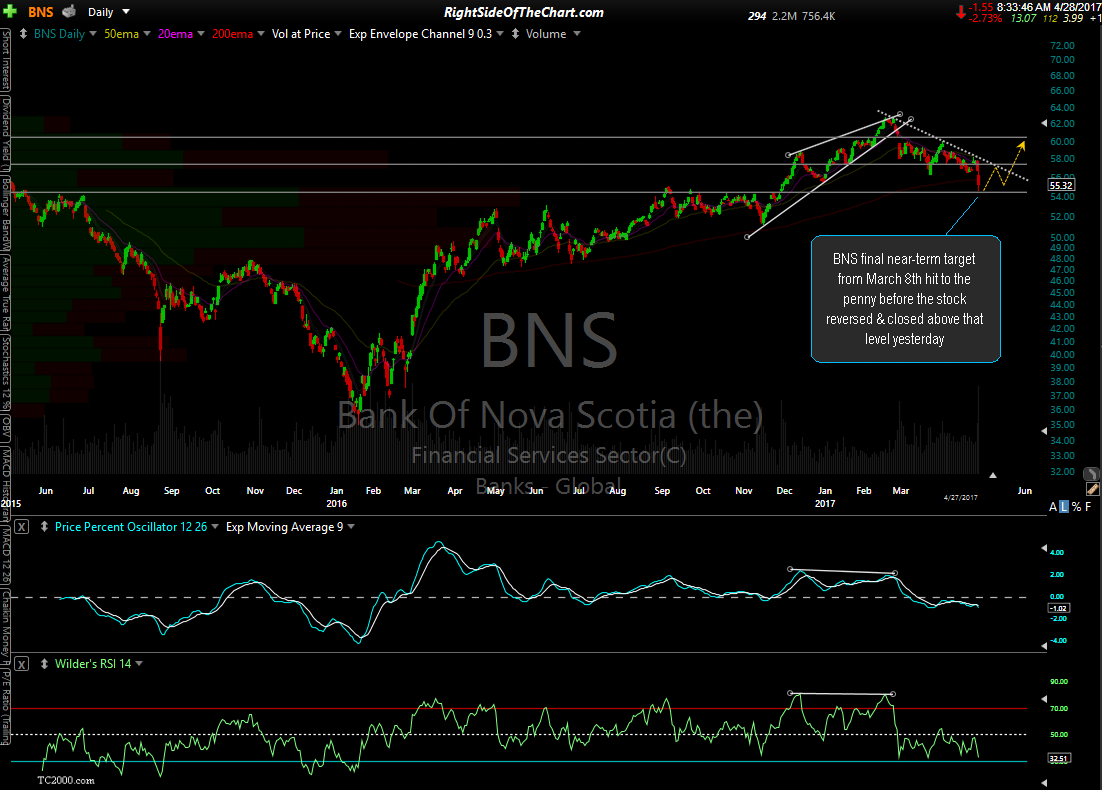
BNS final near-term target from March 8th hit to the penny before the stock reversed & closed above that level yesterday.
-
- BNS daily March 8th
-

- BNS daily April 27th close
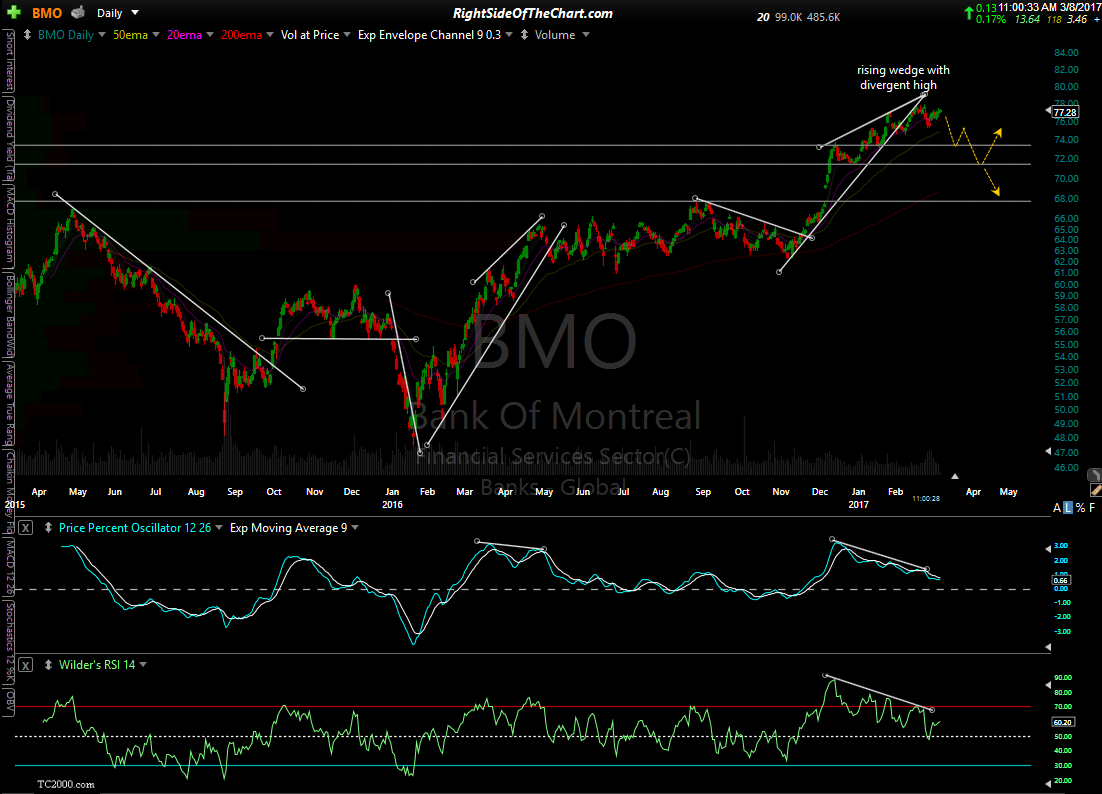
After falling over 9% so far as predicted back on March 8th, BMO continues to work its way down towards my pullback target, which has now been expanded slightly to a target zone (favoring a reversal off the top of the zone at this time).
-
- BMO daily March 8th
-

- BMO daily April 27th

These charts are good examples of how divergences, when properly aligned with sell signals can be used effectively & at times, with a high degree of precision with both timing & estimating the scope of the ensuing rally or correction. In this case, the sell signals following the divergent highs came on either a break below a bearish rising wedge pattern, with prices immediately falling from there without any backtest of the wedge in the case of BNS, or a breakdown & backtest of the wedge from below in the case of the others.
Lee1 recently brought up a good point on how the current divergences in the broad market have continued to build, as have the divergences on the market leading FAAMG stocks, yet the market hasn’t corrected yet, at least not on the most recent divergences. However, with both the broad market & the FAAMGs, we need to see the uptrend lines and/or other key support levels that have been highlighted recently give way in order to trigger a sell signal.