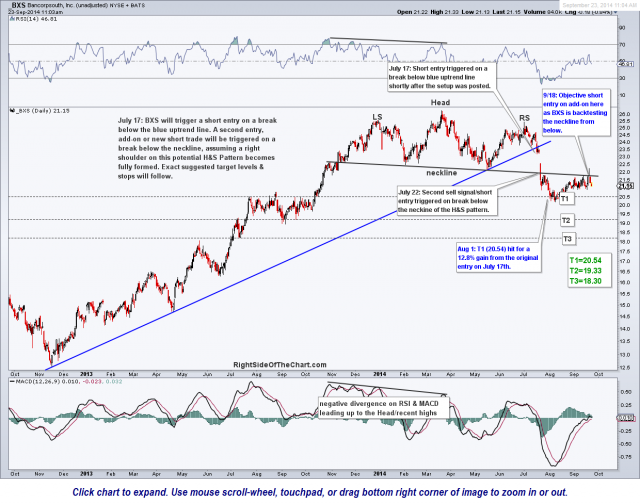
As mentioned yesterday, I plan to update the trade ideas this week & hope to remove all the trades that have either exceeded their suggested stop levels or no longer look compelling from an R/R or technical perspective. My intention is to have all trade ideas updated by tomorrow. However, as I’m seeing increasing evidence that a long overdue significant correction in US equities may be close at hand, I am going to turn my immediate focus on highlighting some of the current trade ideas that still look compelling at this time, starting with BXS (Bancorpsouth Inc).
The live chart to the BXS Active Short Trade was updated along with several other Active Trade Ideas last week. BXS has just recently turned lower after back-testing the neckline of the Head & Shoulders pattern that is still very much in play. BXS was added as a Short Setup back on July 17th & went on to trigger an entry later that day. This trade hit the first price target (T1 at 20.54) for a 12.8% gain on Aug 1st with the typical reaction (bounce or consolidation) from there, which resulted in the recent backtest of the neckline. As BXS is still within close proximity to the neckline, this trade still offers an objective entry or add-on to an existing position with a stop on a solid close above the neckline. As T1 has already been hit, followed by the expected reaction off that level, my expectation would be that the upon the next drop to the T1 level would provide little, if any support with T2 (19.33) as the most likely stopping point for the next move down in the stock.
In addition to prices rolling over following the failed attempt to regain & close above the neckline of the Head & Shoulders pattern, note the bearish posture of the MACD. The MACD line (fast line) is starting to turn lower (i.e.- a bearish crossover is pending… also easily referenced via the MACD histogram) after making an extended run up to the zero line. The zero line on the MACD often acts as support & resistance and that has been the case with BXS, with the stock price in an uptrend when the MACD is above the zero line & a downtrend when below.


