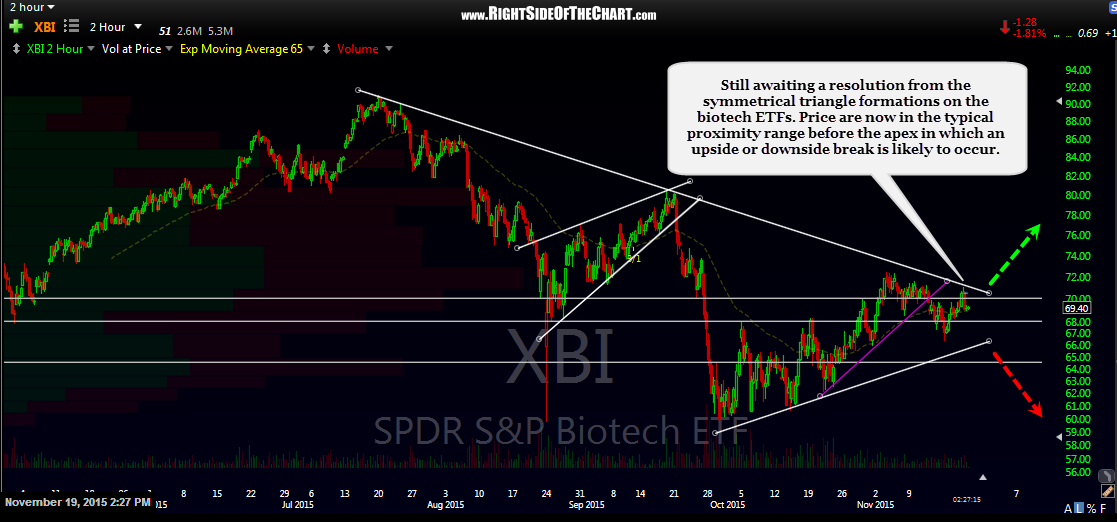
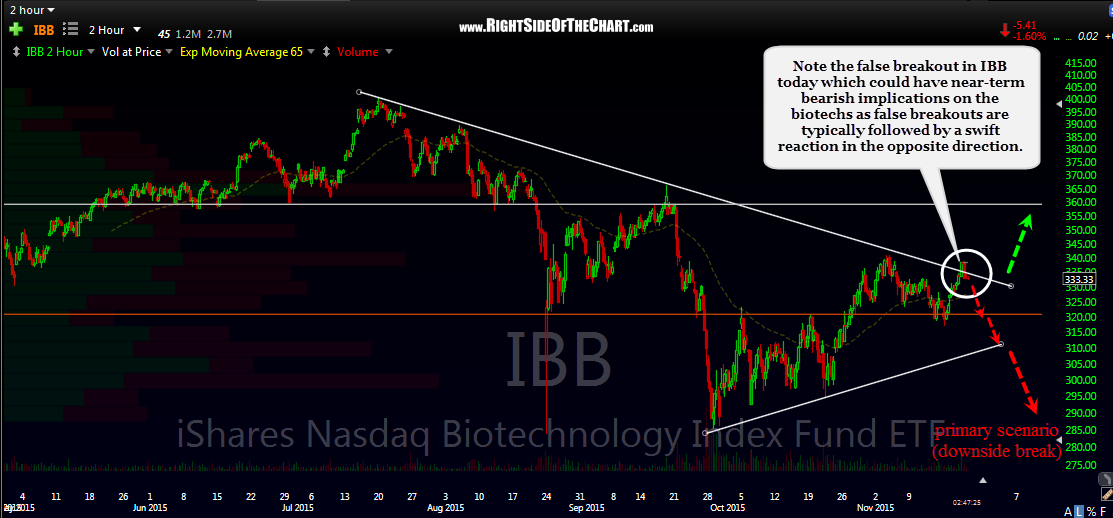
I’m still awaiting a resolution from the symmetrical triangle formations on the biotech ETFs which I first posted just over a week ago. Prices are now in the typical proximity range before the apex of the triangles in which an upside or downside break is likely to occur & so I would expect an upside or downside breakout of these patterns to occur most likely within the next couple of weeks. Until we get a clear resolution of these patterns (on most, not just one of the biotech ETFs), trading the sector is likely to be very difficult as prices chop around within an increasingly narrowing sideways trading range. Note the false breakout in IBB today which could have near-term bearish implications on the biotechs as false breakouts are typically followed by a swift reaction in the opposite direction.
-

- XBI 120 min Nov 19th
-

- XBI 120 minute Nov 19th
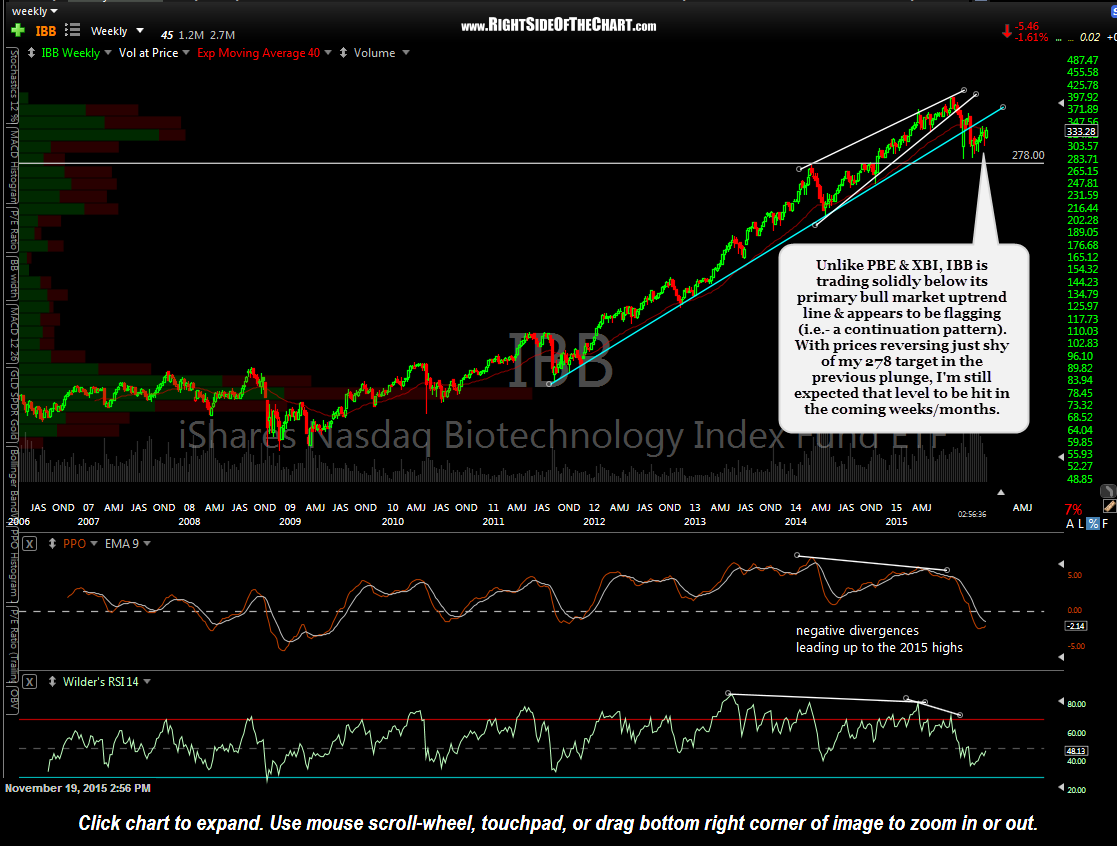
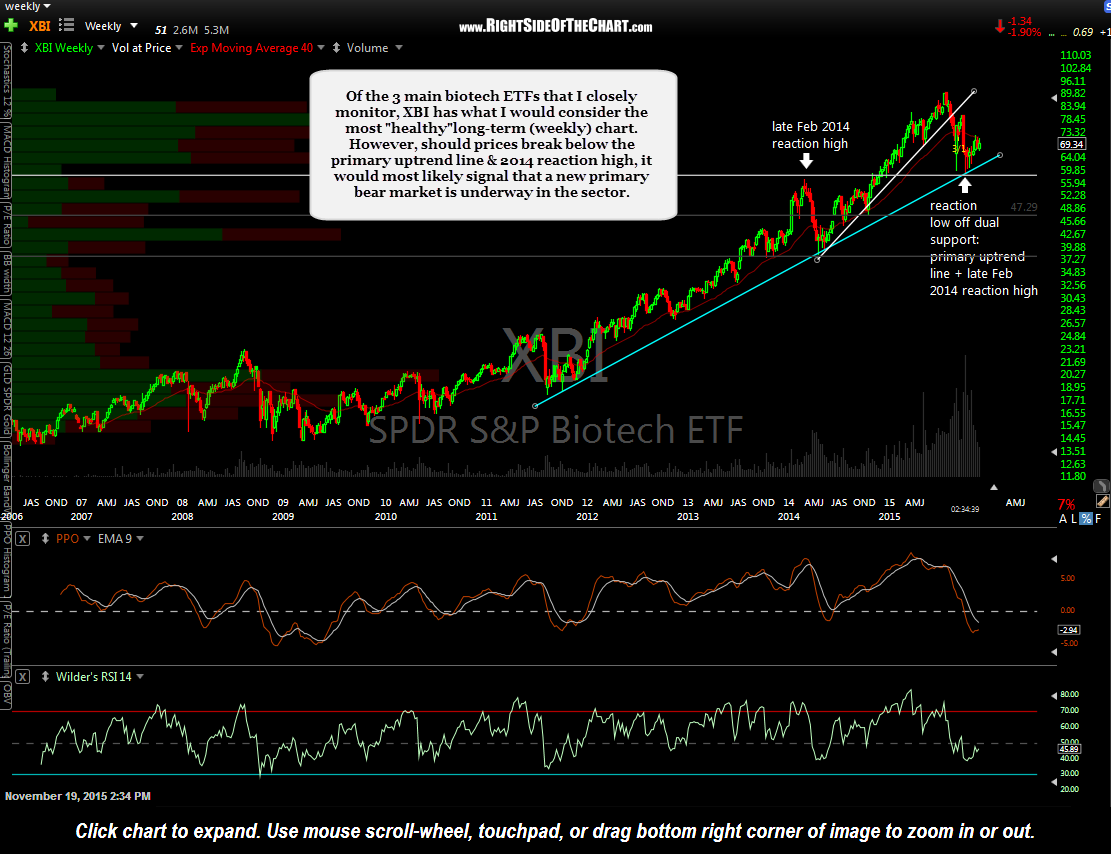
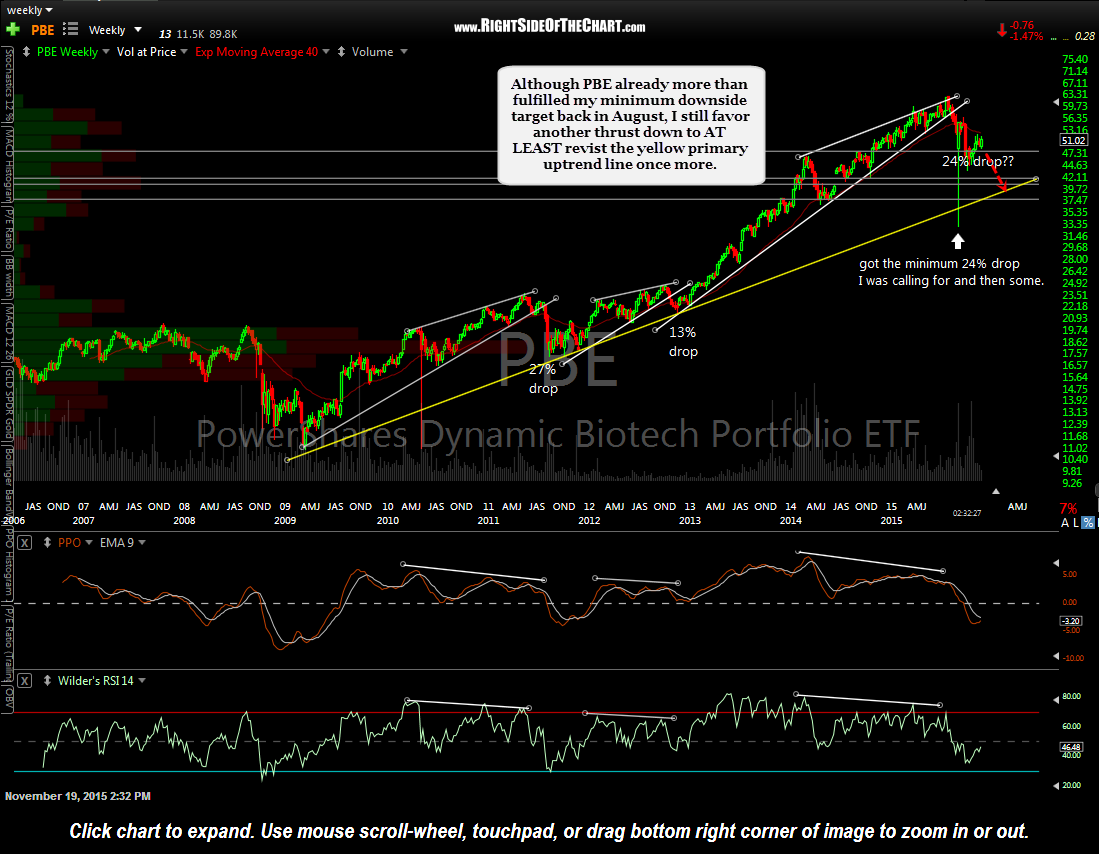
Of the 3 main biotech ETFs that I closely monitor, XBI has what I would consider the most “healthy”long-term (weekly) chart. However, should prices break below the primary uptrend line & 2014 reaction high, it would most likely signal that a new primary bear market is underway in the sector. Although PBE has already more than fulfilled my minimum downside target back in August, I still favor another thrust down to AT LEAST revisit the yellow primary uptrend line once more. Unlike PBE & XBI, IBB is trading solidly below its primary bull market uptrend line & appears to be flagging (i.e.- a continuation pattern). With prices reversing just shy of my 278 target in the previous plunge, I’m still expected that level to be hit in the coming weeks/months.
-

- XBI weekly Nov 19th
-
- PBE weekly Nov 19th
-
- IBB weekly Nov 19th