
This 13-year chart of the $AORD highlights the corrections (10%+ drops) that followed all minor divergent tops (dashed lines) & the bear markets (20%+ drops) that followed the major divergent tops. Although the QEternity believers might say it will be different this time around, the historical price action following such divergences as the one currently in place does not bode well for Australian Equities.
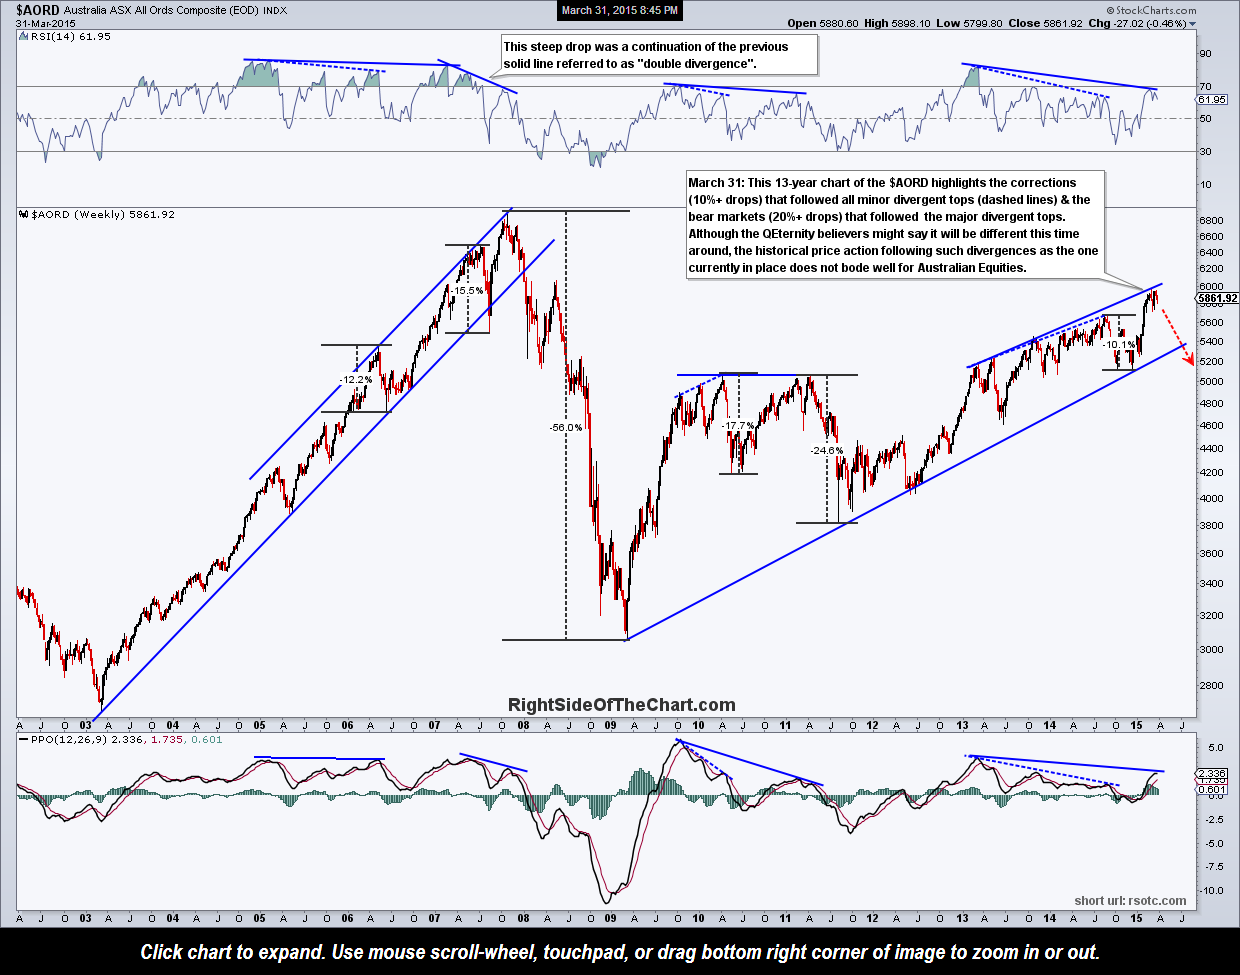
$AORD weekly March 31st