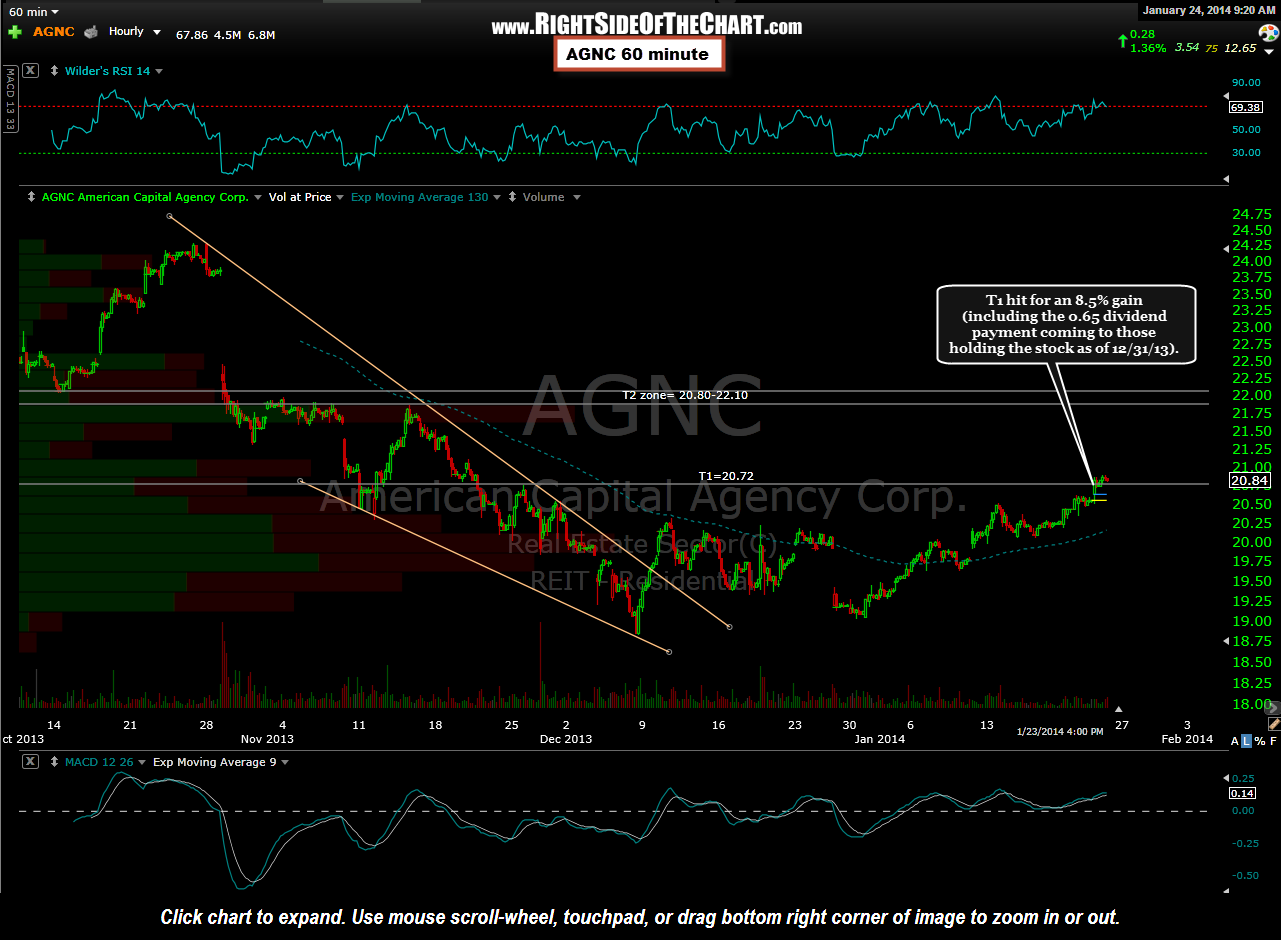
The AGNC (American Capital Agency Corp) trade hit the first target hit for an 8.5% gain (including the 0.65 dividend payment coming to those holding the stock as of 12/31/13). The AGNC setup posted on Dec 9th went on to trigger an entry later that same day on a breakout above the 60 minute bullish falling wedge pattern and hit the first target (20.72) yesterday. AGNC was added as both a typical swing trade idea based off the bullish pattern on the 60 minute chart as well as a Long-term Growth & Income trade idea based off the daily chart. The same levels shown on the previously posted daily chart will be the price targets for the Long-term Trade while T2 on the 60 minute chart will remain the final target for the normal Active Long Trade (typical swing trade).
Even as an active swing trader, I own all of the Growth & Income Trades in my longer-term account (with the exception of PWE which needs to be removed from the list for exceeding any reasonable stop criteria). Other than the fact that the charts remain bullish on these trades as well as the above average dividends, from a fundamental perspective, these trades should get a boost assuming that interest rates do continue to fall as discussed in yesterday’s Treasuries & Junk Bonds post. I will try to update the Growth & Income Trades asap, including some live chart links.
Below are the previous & updated 60 minute & daily charts for AGNC. Again, consider this as two separate but related trades; A typical swing trade based off the 60 minute bullish falling wedge pattern as well as a Growth & Income Trade which is a sub-category of the Long-term Trades category (a description of each trade category appears at the top of each category page, accessible under the Trading & Investment Ideas tab at the top of the site). The updated charts were dated with yesterday’s date as they the screenshots were taken & the annotations made before the open today.
-

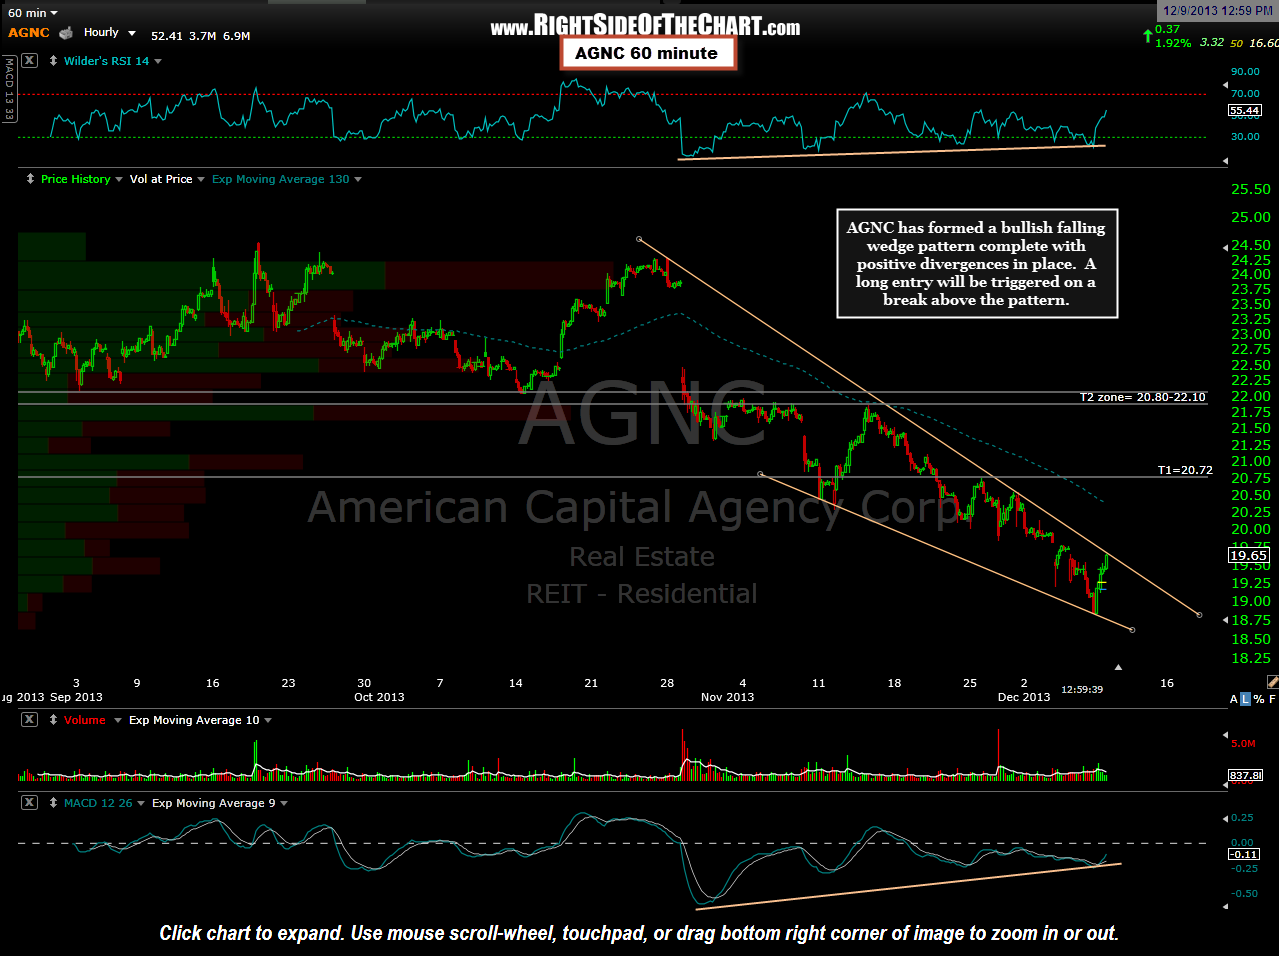
- AGNC 60 minute Dec 9th
-
- AGNC 60 minute Jan 22nd
-
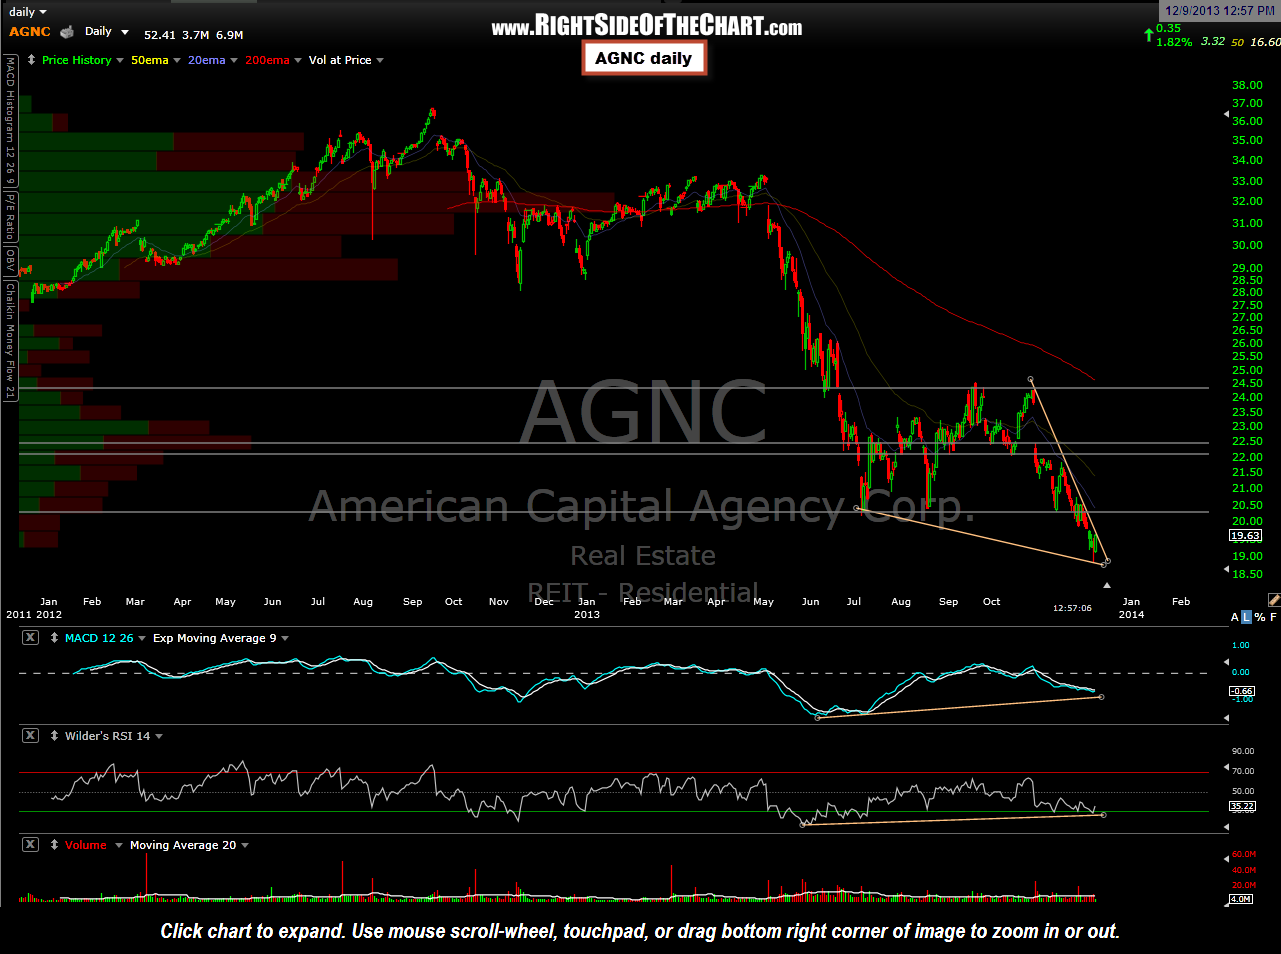
- AGNC daily chart Dec 9th
-
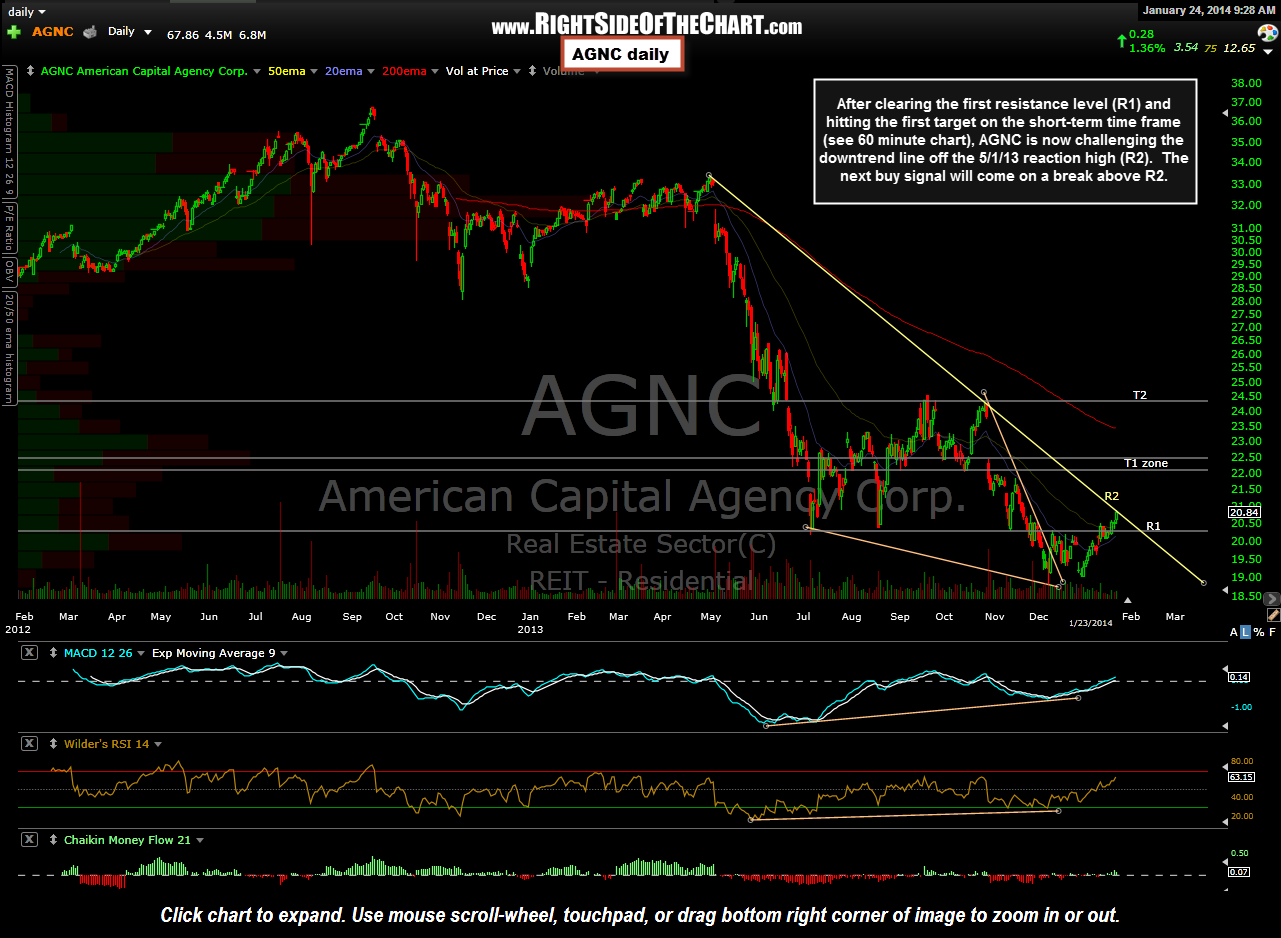
- AGNC daily Jan 22nd